Falling Out of the Lead: Following High Achievers Through High School and Beyond
Introduction
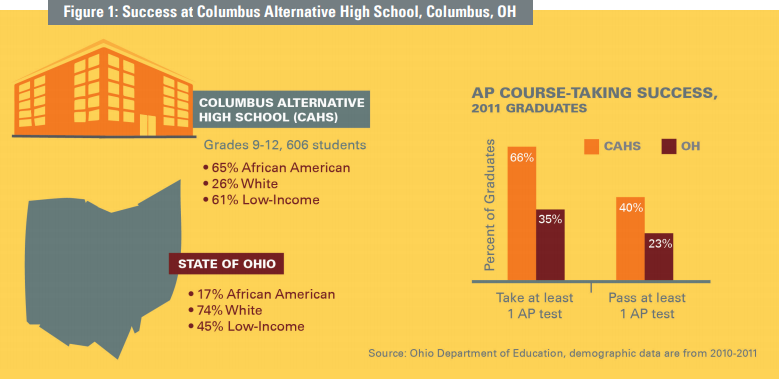
Walk into Columbus Alternative High School (CAHS) on a late-August morning, and you’ll see roughly 250 new freshmen entering through the Ohio school’s front doors. The students come from 26 different middle schools and exhibit widely varying levels of academic preparation upon arrival, the perennial challenge for high schools across the country.
CAHS’ leaders take this challenge seriously, providing personalized support and intensive coaching to freshmen who enter behind. But what truly distinguishes this school is its commitment to accelerating and enriching kids who enter at every level, even at the top.
Starting in ninth grade, all students are introduced to honors coursework, and by junior year, students are expected to take Advanced Placement or International Baccalaureate English. Because of this rigorous but supportive culture, students who are behind catch up, and high achievers soar in a demanding environment.
Their efforts are paying off: Not only did nearly all students (98 percent) graduate in 2011,1 66 percent of the school’s graduating class took at least one AP test, with 40 percent passing an exam. Statewide, only 35 percent of graduates took an AP exam, and just 23 percent passed one (Figure 1).2
According to Principal Sharee Wells, “What our teachers do very well from day one of freshman year is setting the stage: The level and quality of work expected is at the college level.” And according to a high-achieving graduate of CAHS, Rosa, this level of challenge is what sets CAHS apart. Having been admitted to CAHS via lottery, she says, “My (neighborhood) school wasn’t as academically rigorous. It didn’t have the same kinds of opportunities.”
This approach is not typical of most high schools, which often track students according to their incoming academic skills and serve them separately in low-, middle-, and high-performing groups — ostensibly to better meet their needs. Previous research has questioned the efficacy of this approach, especially for students in the low and middle groups. But that is not our purpose here. Instead, we want to examine what is happening within this system to high-achieving students from different racial and socioeconomic groups.
A previous Education Trust report, Breaking the Glass Ceiling of Achievement for Low-Income Students and Students of Color, described inequities at the high end of the achievement spectrum and found that gaps at the advanced level on the 12th-grade National Assessment of Educational Progress (NAEP) have generally stagnated or grown over the past decade.
In this report, we want to explore the experiences of these high-achieving students. We examine the trajectories of students who are high-achieving when they enter high school and document their success on key indicators of postsecondary readiness, including high school course-taking, performance on AP exams and college admissions tests (SAT/ACT), academic GPAs, and college enrollment patterns.
Our intention is to drill down further and understand if and on what indicators initially high-achieving students of color and low-socioeconomic status (SES) students are getting off track in high school. By better understanding such patterns, we hope educators can look at their practices with a fresh eye and think anew about how to provide truly rigorous opportunities that will best support students of color and low-SES students who are already high-achieving. This responsibility, of course, also lies with elementary and middle schools, but there are actions that high school educators can take now to improve experiences for these students. Schools like CAHS provide some insight into how this work is being done.
Data and Methods
The analyses in this report use data from the Educational Longitudinal Study of 2002 (ELS: 2002), which follows a nationally representative sample of sophomores through high school and into adulthood. First, we examine college readiness indicators, including high school course-taking, success on AP tests, SAT/ACT scores, and academic GPAs.3 Second, we analyze college enrollment patterns. The college readiness analyses are representative of about 2.5 million public school sophomores who had complete transcript data two years later, and the postsecondary analyses are representative of about 3 million public school sophomores who were surveyed four years later about their college and work experiences.4
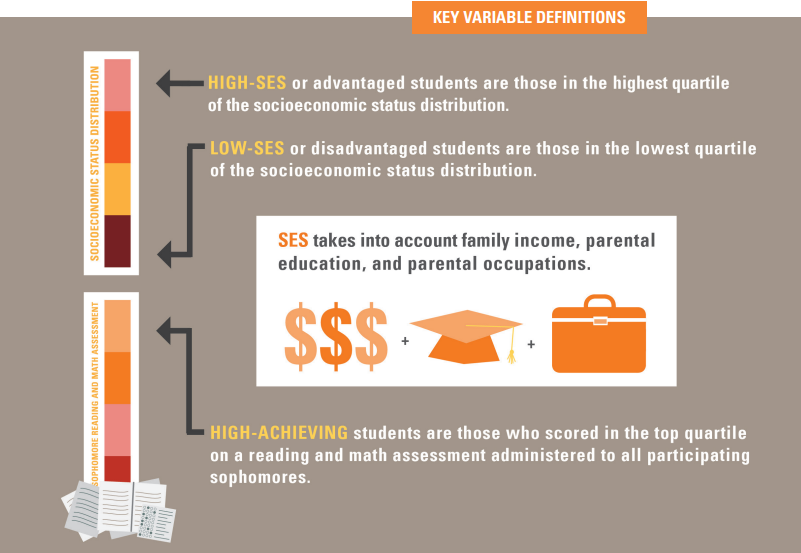
The focus of this report is on high-achieving students. To identify this group, we selected students who scored in the top quartile (i.e., better than 75 percent of their peers) on a lowstakes reading and mathematics assessment administered to all participating sophomores. There is, of course, variability in this group as it includes the very highest achieving students (>90th percentile), and we expect a range of performance on our outcome variables. However, our analysis focuses on comparing the average performance, which we expect should be similar across racial and socioeconomic groups.5 The reading and math assessment is unique to the ELS study, but it is primarily composed of questions from other well-developed assessments, such as NAEP and the Programme for International Student Assessment (PISA). The top quartile of performers on the ELS assessment represents roughly 654,430 students.6
Throughout our results, we compare the outcomes of subgroups of high-achieving students, describing differences that are statistically significant. Some data, on the surface, may seem different, but we rely on significance tests to determine if outcomes are truly dissimilar.7 We compare high-achieving black and Latino students to high-achieving white students, and separately, we compare high-achieving low-SES students to high-achieving high-SES students.
Socioeconomic status is a measure of relative advantage, accounting for multiple background characteristics, including family income, parental education, and parental occupations. When we refer to low-SES (or disadvantaged) students, we mean students in the lowest quartile of the SES distribution, and when we refer to high-SES (or advantaged) students, we mean those in the highest quartile of the SES distribution.
These comparisons are not intended to suggest that white and high-SES students are normative groups, but rather to help identify where inequities in opportunity and achievement exist, so that schools and communities can work to remedy them.
Our results are descriptive and informative, but do not test why differences occur. Our goal is to shine a light on trends that currently exist in our schools to promote reflection and raise questions.
To supplement the quantitative data, we interviewed five high-achieving students who participated in the Jack Kent Cooke Foundation’s Young Scholars Program. The foundation selects approximately 60 Young Scholars annually (out of 2,000 applicants) who have demonstrated high ability and achievement, financial need, persistence, and the desire to help others. The average family income of selected students is about $25,000. Once accepted, Young Scholars are paired with an educational adviser, who provides academic guidance, assesses needs and opportunities, identifies resources, and assists through the high school and college selection processes. The foundation provides financial support for Young Scholars from eighth grade through high school, ranging from school expenses and technology to extracurricular activities and residential summer programs.
We interviewed the students within six months of their high school graduation to hear in their own words how their high schools supported their development as high achievers and prepared them for college. These students also provided advice for other high schools on how to support high-achieving students. Although not representative of all high-achieving students, their stories help deepen our understanding of the student experiences behind the numbers we present.
At the Start
When students walk through the door of their high schools for the first time, troubling gaps in achievement already exist. These gaps are related to differences in achievement that students bring with them to kindergarten, as well as differential preparation in elementary and middle schools that does little to close those initial gaps.8 Below, we describe the gap by examining the percent of students scoring in the top achievement quartile early in high school, i.e., those who outperform 75 percent of all students in reading and math. We also look within the group of high-achievers to see what types of schools they are attending.
Who Is High-Achieving?
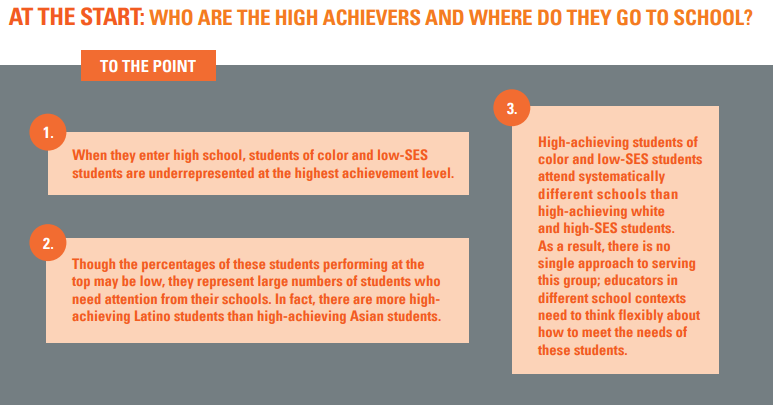
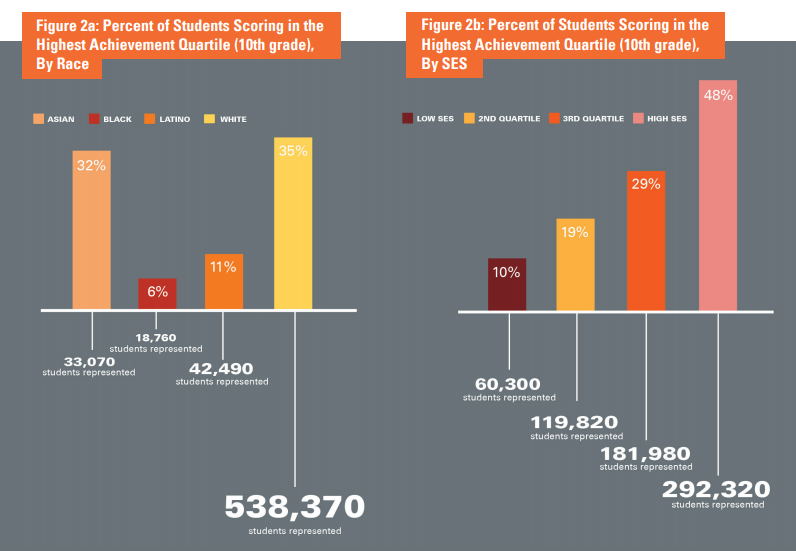
By Race/Ethnicity: Initially, roughly 1 in 17 black students and 1 in 9 Latino students perform in the top achievement quartile. These rates are substantially below those of white and Asian students, roughly 1 in 3 of whom perform in the top quartile (Figure 2a).9
But although the percentages for students of color are low, they represent large numbers of students whose talents need to be developed and channeled. For instance, there are over 42,500 high-achieving Latino students in the sophomore population, which actually exceeds the number of high-achieving Asian students (about 33,000), since Asian students constitute a smaller proportion of the overall population.
By SES Groups: When the lens is family advantage or disadvantage, the patterns are equally troubling. Only 1 in 10 disadvantaged students perform within the highest achievement quartile, compared with nearly half of students from the most advantaged homes (Figure 2b).10 Again, the 10 percent of low-SES sophomores performing in the highest achievement quartile represent a substantial number of students throughout the country: more than 60,000.
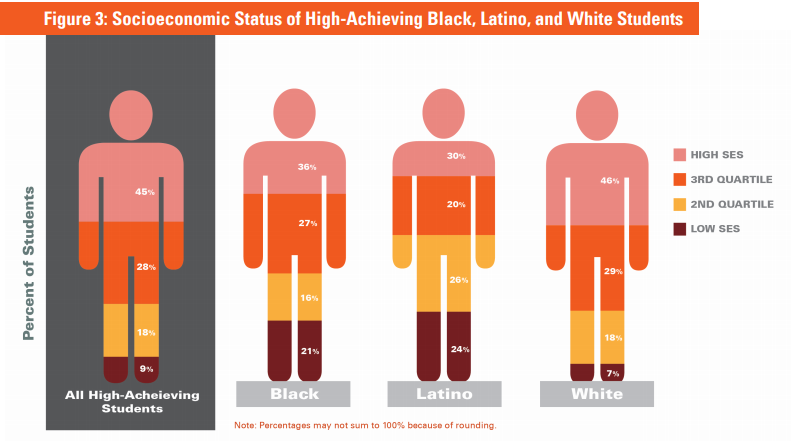
Intersection of Race and SES Groups: High-achieving students, in general, are disproportionately high-SES: 45 percent as compared with 25 percent in the overall population. High-achieving students of color, though, are more likely to span the socioeconomic distribution than white high-achieving students, who are far more likely to be in the middle- or high-SES groups.
High-achieving black and Latino students are roughly three times as likely as high-achieving white students to come from low-SES families (Figure 3). That said, high-achieving black and Latino students are more likely to be high-SES than their overall populations.
In number, however, there are more high-achieving white students from disadvantaged families than high-achieving black or Latino students from disadvantaged families. So, in the analyses that follow, it is important to keep in mind that high-achieving students of color are largely a different group of students than high-achieving low-SES students.
Where Do High-Achieving Students Attend School?
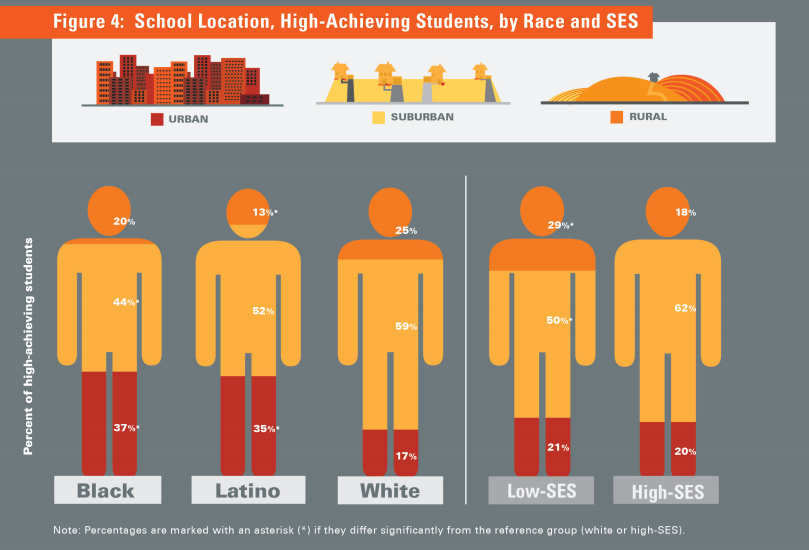
By Race/Ethnicity: The size, geographic setting, and student populations of schools attended by high-achieving students tend to vary along racial lines. For example, high-achieving black and Latino students are much more likely to attend urban schools and less likely to attend suburban schools than their high-achieving white counterparts (Figure 4). Specifically, more than 35 percent of high-achieving black and Latino students attend an urban school, compared with just 17 percent of white students. Meanwhile, just 44 percent of high-achieving black students attend a suburban school, while nearly 60 percent of high-achieving white students do so.11
Perhaps related to these school settings, high-achieving students of color tend to go to larger schools, compared with high-achieving white students. The average school enrollment for high-achieving black students is nearly 1,700 students, and the average enrollment for high-achieving Latino students is more than 2,000. Meanwhile, the average school size for high-achieving white students is less than 1,400 students.12
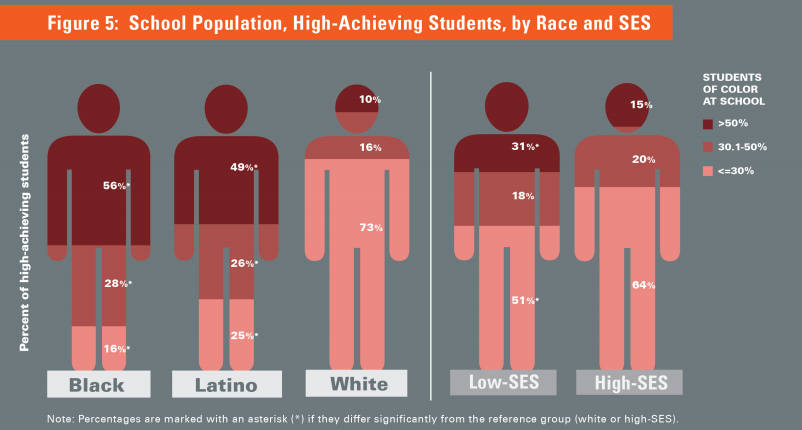
High-achieving black and Latino students are also more likely to attend schools with other students of color, while high-achieving white students are likely to attend schools with other white students. For example, at least half of high-achieving black and Latino students attend schools where more than 50 percent of the other students are students of color, while the vast majority of high-achieving white students (73 percent) attend schools where fewer than 30 percent of students are students of color, (Figure 5).13
By SES Groups: High-achieving students from disadvantaged families are also attending different types of schools than their peers from advantaged families. For example, they are much more likely to attend rural schools (29 vs. 18 percent).14 Meanwhile, they are slightly less likely to attend suburban schools but about as likely to attend urban schools (Figure 4). Their schools also tend to be smaller, by an average of about 250 students, than the schools of high-SES students, perhaps because of the rural location.
Low-SES students are also more likely than high-SES students to attend schools that serve predominantly students of color. About 30 percent of high-achieving low-SES students attend schools where more than half of the students are black, Latino, or American Indian, compared with 15 percent of high-achieving high-SES students (Figure 5).
The different types of schools attended by high-achieving students suggest their experiences likely differ, and these different experiences could be related to the patterns we will see in the following analyses. While we believe all schools can offer enriching, rigorous opportunities to students regardless of their size and location, these characteristics are an important consideration when determining how to best structure opportunities for high-achieving students.
In the End
High school courses are critically important to students’ futures. This is, in part, because college admissions officials pay close attention to the richness of high school transcripts, but also because advanced coursework exposes students to rigorous content that will help them succeed in college and beyond. As CAHS principal Sharee Wells says, “If you’re preparing someone for the next level, the only way to be prepared is to experience it.” Research consistently documents the benefits of completing a core academic curriculum, including an increased likelihood of enrolling in college and earning a degree.15
But in many cases, students’ access to rigorous courses has a lot to do with their experiences before they even get to high school. When it comes to high school course-taking, academically prepared students have a huge advantage over less prepared students. Students who start high school as high-achieving are substantially more likely than those who start out as low-achieving to complete advanced math and science classes, AP/IB courses, and, ultimately, the full academic course load that sets them on a path to future success. (See Data Appendix for a summary of these trends.)
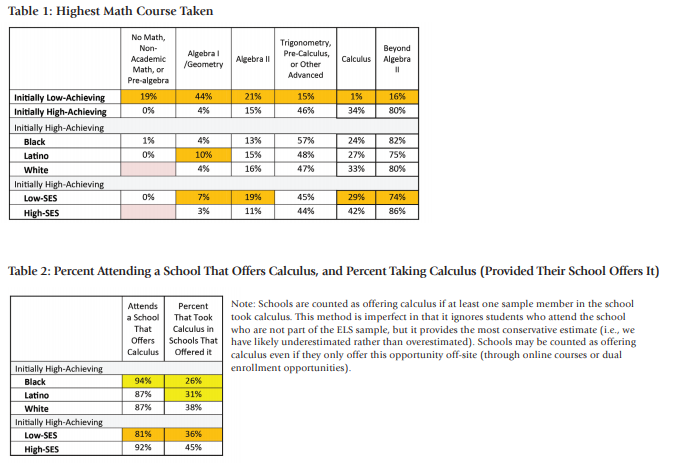
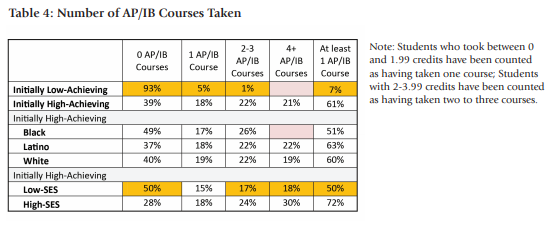
For instance, the vast majority of initially high-achieving students, 80 percent, complete a math course beyond Algebra II, with a third of these students taking calculus. They are five times more likely to reach advanced math than initially low-achieving students — only 16 percent of whom reach a course beyond Algebra II. Similarly, high-achievers are 9 times more likely than low-achievers to take an AP or IB course. Initially low-achieving students are virtually shut out from these courses, with only 7 percent taking one or more AP or IB courses, compared with over 60 percent of initially high-achieving students.
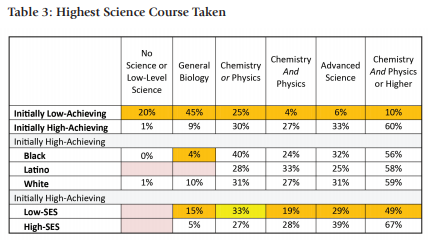
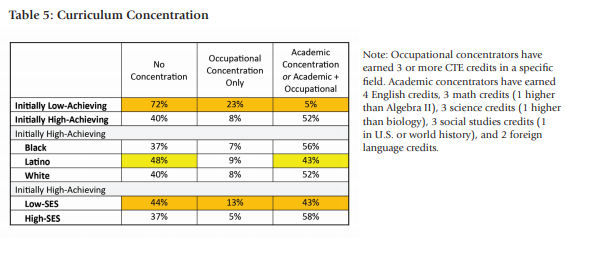
These patterns are replicated in virtually every subject area, rendering initially high-achieving students 10 times more likely than initially low-achieving students (52 percent vs. 5 percent) to complete an academic concentration, which consists of four English credits, three math credits (including a course beyond Algebra II), three social studies credits (including U.S. or world history), three science credits (including a course beyond biology), and two foreign language credits.
We now want to turn our attention to just the high-achieving group to better understand if such opportunities are being distributed equitably. Here, the data paint a mixed picture.
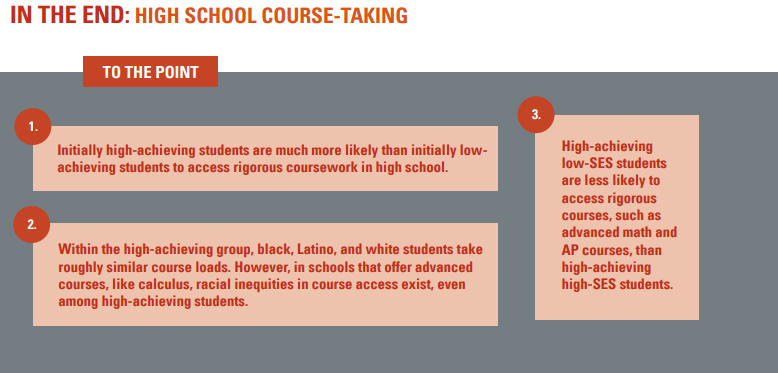
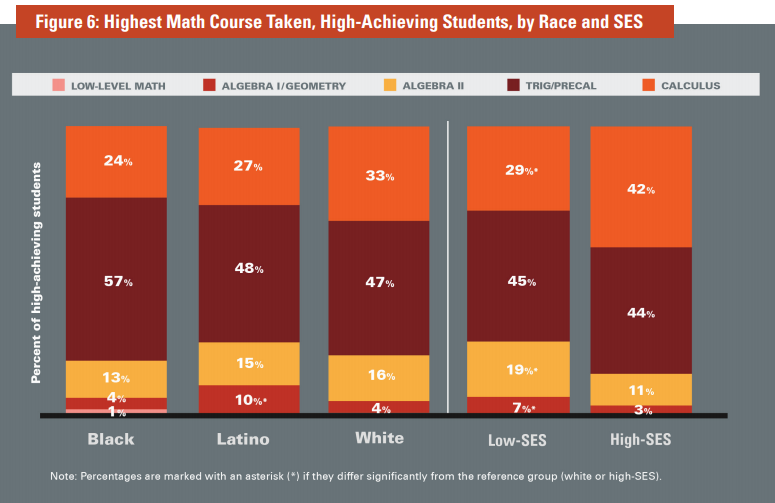
By Race/Ethnicity: When we focus squarely on equity between white students and students of color within the high-achieving group, we find some good news: Initially high-achieving students are similarly likely to take advanced courses, regardless of their race. For instance, there are not significant differences by race in the percent of students who reach a math course beyond Algebra II, take physics and chemistry, gain access to AP/IB courses, or complete an academic concentration (Figure 6).16 (See Data Appendix for a summary of each indicator.) Overall, these results suggest that high-achieving white, black, and Latino students are taking roughly similar courses in high schools.
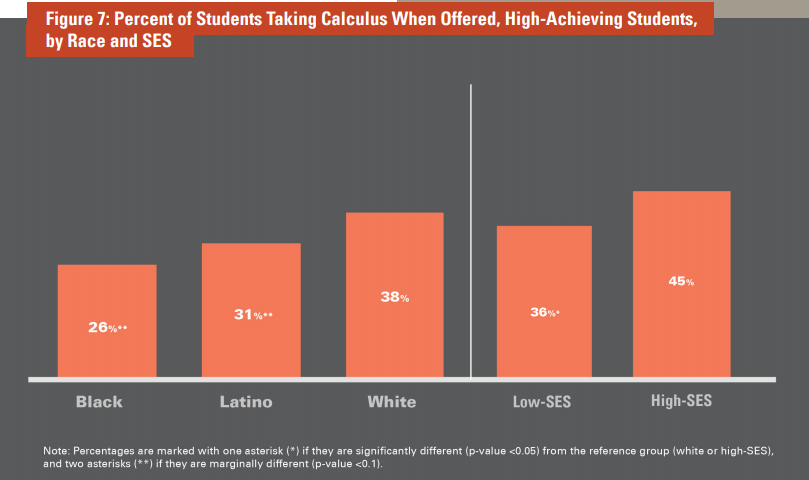
There are, however, some differences. While 87 percent of high-achieving white and Latino students and 94 percent of high-achieving black students attend schools that offer calculus, a capstone math course, inequities exist within those schools in terms of who takes it and who doesn’t.17 For example, when we examine only those students attending schools that offer calculus, we find that 26 percent of high-achieving black students enroll in this course, compared with 38 percent of high-achieving white students (Figure 7).18 In other words, although calculus is widely available across schools, academically prepared white students remain more likely to gain access than similarly prepared black and Latino students.
A previous Education Trust study of AP course enrollment finds a similar pattern: Despite the democratization of AP course offerings throughout the country, schools that offer these classes have made them more available to white and higher income students than to black, Latino, and low-income students.19
By SES Groups: Unlike high-achieving students of color, high-achieving disadvantaged students have fewer curricular opportunities than similarly prepared advantaged students across the board. Low-SES students are less likely to take advanced math courses, advanced science courses, AP/ IB courses, and a full academic course load than their similarly prepared high-SES peers. (See Data Appendix for a summary of each indicator.) For example, 29 percent of high-achieving low-SES students take calculus, compared with 42 percent of high-achieving high-SES students (Figure 6). Similarly, only about 50 percent of high-achieving low-SES students take at least one AP course, compared with more than 70 percent of high-achieving high-SES students. Large inequities in AP access exist across all AP subject areas, with the exception of foreign language.
And these inequities in individual courses add up: 43 percent of high-achieving students from disadvantaged families complete an academic concentration, compared with 58 percent of high-achieving students from advantaged families.
While the majority of high-achieving students attend schools that offer advanced coursework, low-SES students are slightly less likely than high-SES students to attend schools where such courses are available. Specifically, 81 percent of high-achieving low-SES students attend schools that offer calculus, compared with 92 percent of similarly prepared high-SES students.
Nonetheless, even in schools that offer calculus, high-achieving low-SES students are less likely to access it. For example, only 36 percent of high-achieving low-SES students attending these schools actually take calculus, compared with 45 percent of high-SES students (Figure 7). These within-school gaps conspire with between-school gaps to generate large inequities between low- and high-SES students.

Labels on the courses students take in high school only tell us part of the story. In fact, there is a considerable body of research showing that there are wide differences in both content and expectations in courses with the same name.20
Unfortunately, there are not meaningful ways to measure course quality in our data. But we can examine student outcomes associated with courses, with the expectation that initially high-achieving students with similar instruction would obtain similar results, regardless of their race or SES. Inequities along these outcomes might signal differences in instructional quality, academic support, or classroom culture.21
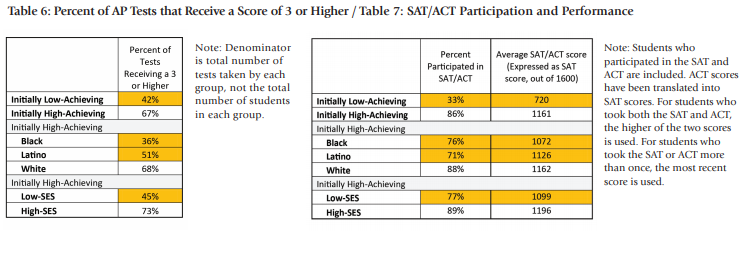
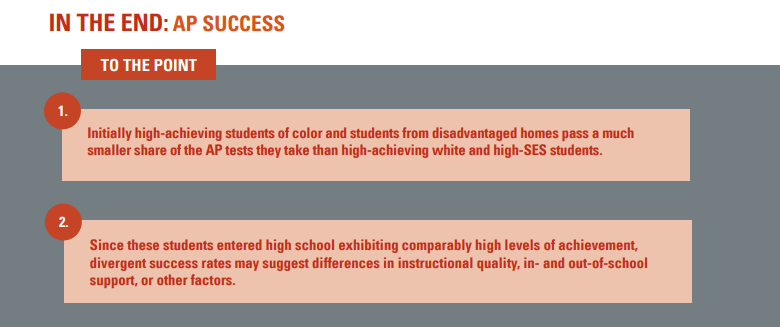
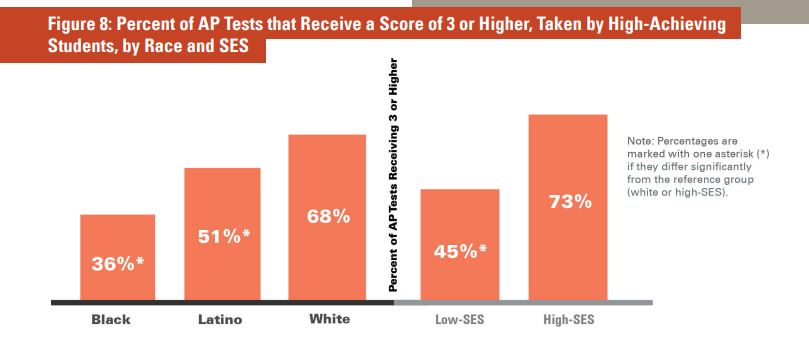
By Race/Ethnicity: While the AP course-taking patterns of high-achieving black, Latino, and white students are roughly similar, high-achieving students of color obtain passing scores on a smaller share of the AP tests they take than high-achieving white students.22 Specifically, high-achieving black students pass about 36 percent of all the AP tests they take (with a 3 or better), and high-achieving Latino students pass 51 percent. Meanwhile, high-achieving white students pass 68 percent of the AP tests they take (See figure 8, page 13).23
By SES Groups: Gaps between disadvantaged and advantaged students are roughly similar to those between students of color and white students on AP tests. High-achieving low-SES students are less likely than their high-SES counterparts to take AP courses to begin with, but those who do are also less likely to pass them: High-achieving low-SES students pass 45 percent of all the AP tests they take whereas high-achieving high-SES students pass 73 percent of their exams (Figure 8).
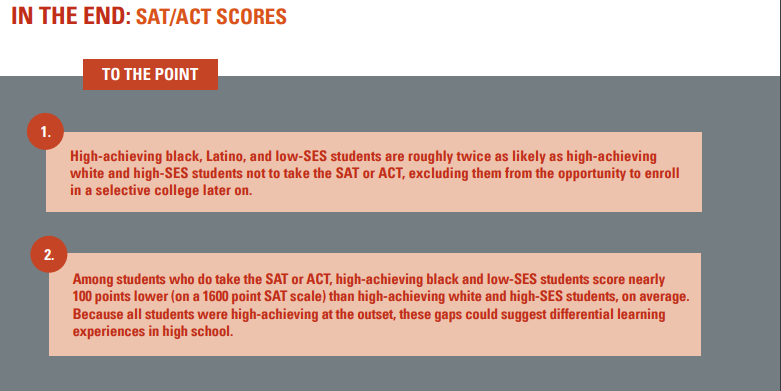
By Race/Ethnicity: To start, many high-achieving students of color don’t even have the opportunity to bubble their names onto their test booklet, ultimately relegating them to less selective colleges and universities. This occurs because many high-achieving black and Latino students do not ever take the SAT or ACT: 24 percent of high-achieving black students and 29 percent of high-achieving Latino students do not take either of these assessments, compared with only 12 percent of high-achieving white students.
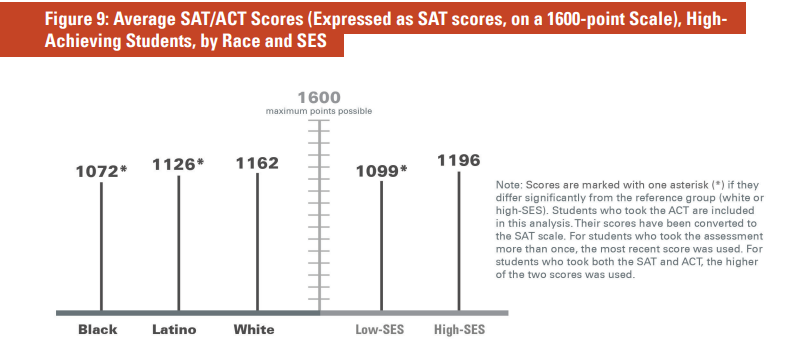
What’s more, those high-achieving students of color who do take the SAT or ACT score lower than their white counterparts.25 For instance, the average SAT score for high-achieving black students is 1072 out of a possible score of 1600, about 90 points lower than the average score for high-achieving white students: 1162. Highachieving Latino students score in between these two groups, with an average score of 1126 (Figure 9). The gap between high-achieving Latino and white students appears to be concentrated on the verbal portion of the SAT, as high-achieving Latino students do not score significantly lower than high-achieving white students on the math portion. Meanwhile, high-achieving black students score about 50 points lower than high-achieving white students on the math portion, highlighting a gap in both subtests.
By SES Groups: High-achieving low-SES students are also less likely than high-SES students to take the SAT or ACT: 23 percent do not take either assessment, compared with 11 percent of high-SES students.
Still, high-achieving low-SES students who do take the SAT or ACT score about 100 points lower (on the SAT scale) than their high-SES counterparts. The average lowSES student scores a 1099 out of 1600, while the average high-SES student scores an 1196 (Figure 9).
So, just as high-achieving white students gain an edge over high-achieving black and Latino students on the SAT and ACT, more advantaged students have a considerable advantage over less advantaged students, even though these two groups performed similarly in reading and math when they started high school.

High school grades are another key indicator of a student’s ability to enroll and succeed in college. Research consistently finds that grades are a stronger predictor of college GPA and graduation than SAT scores, class rank, and family background.26 High school grades differ from outcomes like AP and SAT/ACT scores because they measure more than what a student has learned in a course; they also include more subjective components, such as a teacher’s perception of a student and a student’s study habits.
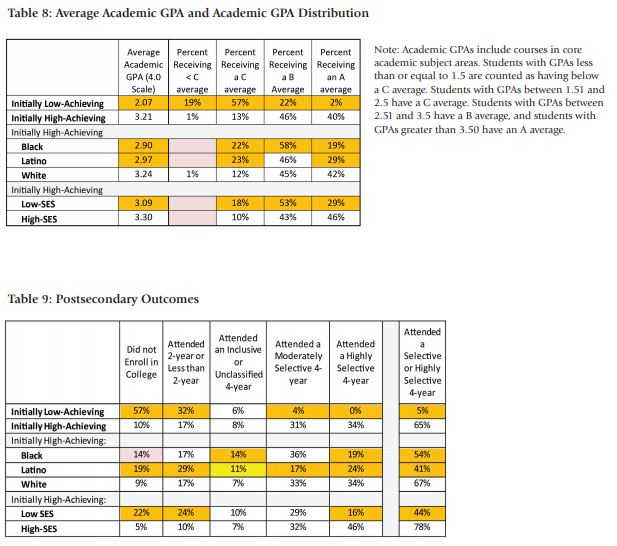
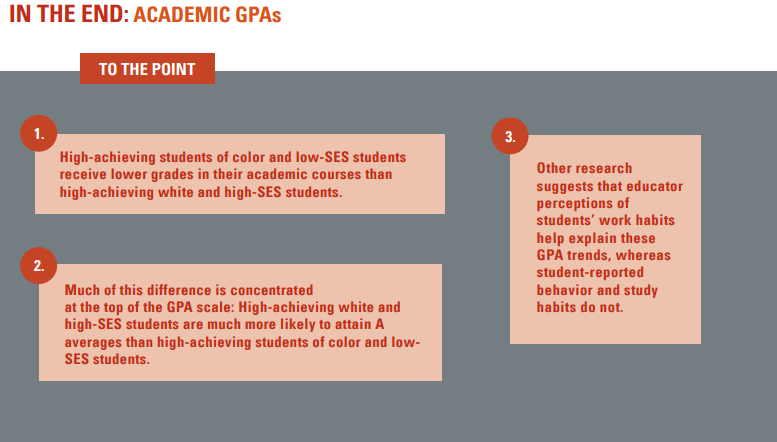
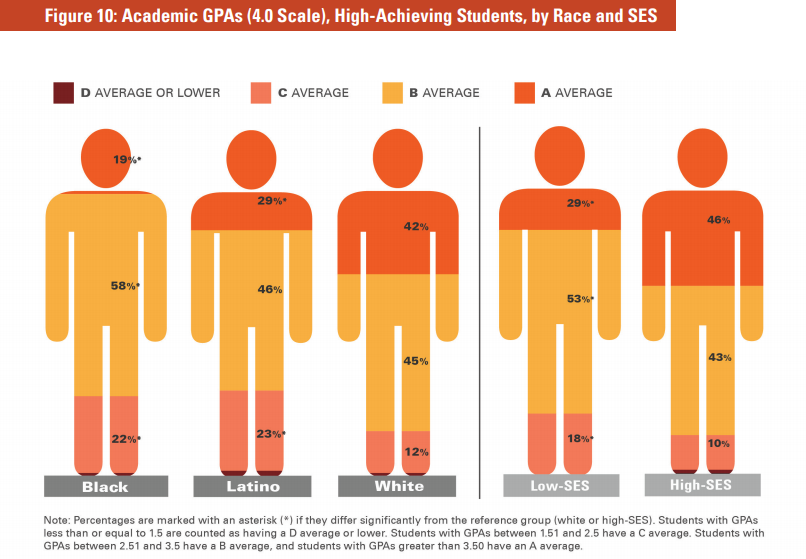
By Race/Ethnicity: The academic GPAs of high-achieving students of color are considerably lower than those of high-achieving white students, eliciting cause for concern.27
The average high-achieving black student receives a 2.90 GPA in his academic courses, which equates to about a B-/B. Similarly, the average high-achieving Latino student receives a 2.97 GPA, which is a solid B. By contrast, the average high-achieving white student receives a 3.24 academic GPA, which is roughly a B+ average. So, there is about a 0.3 GPA gap between high-achieving white students and students of color.
The real differences, though, are located at the tails of the GPA scale. Specifically, at the top end, high-achieving black students are only half as likely as high-achieving white students to receive an A average. Conversely, at the low end, high-achieving black and Latino students are almost twice as likely as their white counterparts to receive a C average or lower (Figure 10).28
By SES Groups: Similarly, there is a 0.21 GPA gap between high-achieving low- and high-SES students. On average, low-SES students receive a 3.09 GPA in their academic classes, about a B on the 4.0 scale. High-SES students, on average, receive a 3.3 academic GPA, or a B+ average.
The largest difference between low- and high-SES students exists at the top of the GPA scale as well. Less than a third (29 percent) of high-achieving disadvantaged students receive an A average in their academic courses in high school, compared with nearly half (46 percent) of high-achieving advantaged students (Figure 10).
Our data are not explanatory. But, a recent study may help readers understand these differences. The researcher found that black students receive lower GPAs than their academic preparation would seem to warrant, while the opposite is true of white students.29 The study examined a host of student, family, and school characteristics that could be related to this anomaly, but found that just one factor accounted for a considerable proportion of the GPA gap: teacher perceptions of students. In particular, teacher beliefs about how hard their students worked explained a great deal of this gap, as opposed to student-reported study habits and behavior records.30
In terms of equitable high school experiences among high-achieving students, the data thus far paint a mixed picture. On the one hand, high-achieving students of color mostly amass similarly rigorous courses on their transcripts as high-achieving white students. On the other hand, high-achieving low-SES students remain less likely than high-achieving high-SES students to access rigorous courses. And both groups of students receive lower marks on AP exams, college entrance exams, and report cards, compared with initially similar white and high-SES students.
These are outcomes that count when it comes to opportunities after high school. And indeed, when we follow students who started high school as high-achieving into adulthood, we again see a mixed picture.31
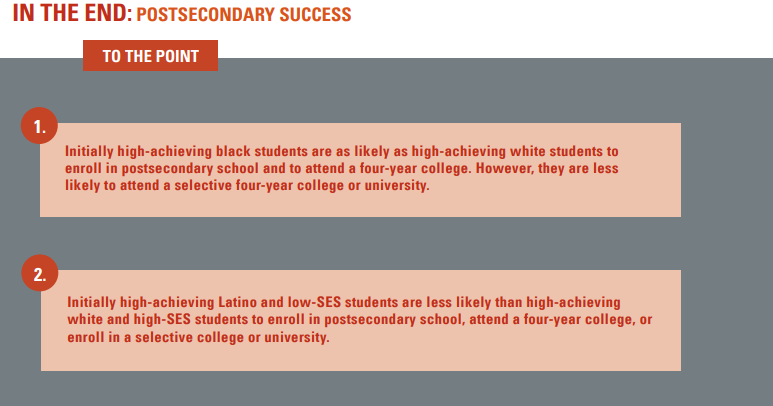
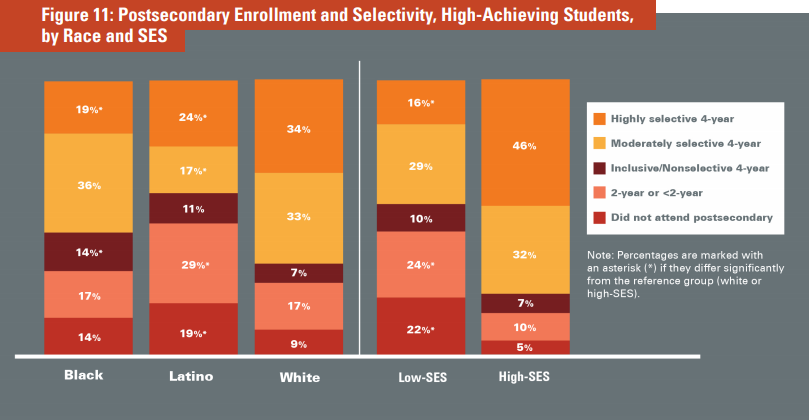
By Race/Ethnicity: When we focus on the postsecondary outcomes of high-achieving students, there is some good news: White and black students are about as likely to enroll in postsecondary education (91 and 86 percent enroll, respectively), and what’s more, they are about as likely to enroll in four-year colleges and universities (74 and 69 percent, respectively) (Figure 11).32
Initially high-achieving Latino students, on the other hand, don’t fare quite as well. Only 81 percent of this group enrolls in college, significantly less than the 91 percent of white students who enroll. Latino students who do enroll in college are much more likely than white students to enroll in a two-year college as opposed to a four-year: 29 percent of high-achieving Latino students enroll in a two-year college or certificate program, whereas only 17 percent of high-achieving white students do so (Figure 11).
However, for both high-achieving black and Latino students, the real inequities appear when examining which four-year colleges these students end up enrolling in.
Unfortunately, the college enrollment patterns of black and Latino students mirror their high school experiences. Initially high-achieving black students, while nearly as likely as white students to attend a four-year college, are twice as likely to attend a non-selective college — in other words, one they could likely have entered even if they hadn’t cracked a book in high school, much less taken all those advanced courses.33
While 2 out of 3 high-achieving white students enter a moderately or highly selective college, only about half of high-achieving black students and 4 in 10 high-achieving Latino students do so.34
By SES Groups: The college enrollment patterns of highachieving low-SES students fall short of their more well-off peers.
First, more than 1 in 5 high achievers from disadvantaged families don’t go to college at all, compared with fewer than 1 in 20 high achievers from advantaged families. Those low-SES students who do go are much more likely to enroll in two-year colleges, as opposed to four-year colleges. About 1 in 4 high-achieving low-SES students enroll in a two-year or less-than-two year college, compared with about 1 in 10 high-SES students (Figure 11).
Fewer low-SES high achievers end up in selective colleges, too. Only 44 percent of initially high-achieving low-SES students attend a moderately or highly selective fouryear institution, compared with 78 percent of high-SES students. What’s more, only 16 percent of the nation’s top-achieving low-SES students attend a highly selective college, compared with 46 percent, nearly half, of high-SES students (Figure 11).35
Unfortunately, these institutional differences matter when it comes to college graduation. Students who attend more selective colleges and universities are ultimately more likely to graduate, compared with otherwise similar students who attend less selective colleges.36
Beneath the Numbers
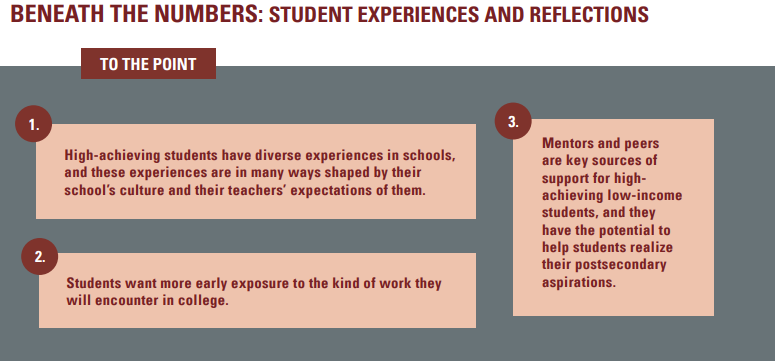
Our interviews with five high-achieving, diverse, low-income students illustrate just how instrumental high school experiences are in preparing students for life after graduation. These students all participated in the Young Scholars Program, a fellowship that taps high-potential eighth-grade students, but they attended different high schools across the country. (See Data and Methods for more about the Young Scholars Program.)
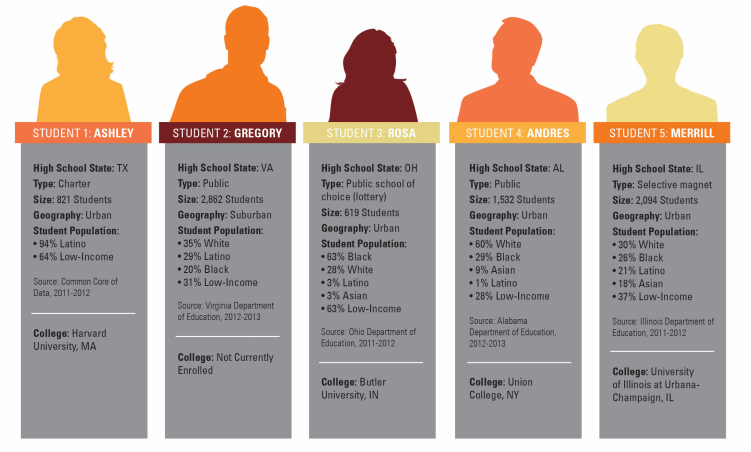
The students shared a few commonalities: All were high-achieving, all received support from a Young Scholars adviser, and most attended high school in an urban setting. But the similarities ended there. The students attended different types of schools, ranging from regular public schools to selective magnets. But more important, their experiences in school varied a lot, and these variations influenced their postsecondary readiness and future plans.
These five students are hardly representative of all the high-achieving students in the country. Yet, their stories strongly mirror the data: They gained access to different levels of opportunity and support based on the schools they attended and the educators they met. Below we share some of their reflections, highlighting the range of experiences they had in their schools. We then turn to their advice on how schools can support other high-achieving students.
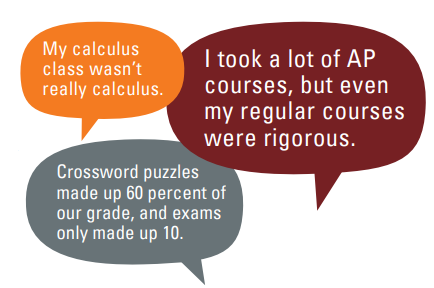
ON COURSES
Course quality varied tremendously among the students we spoke to, with some accessing consistently high-quality courses and others rarely experiencing the type of instruction that would push them to grow academically. Most students fell somewhere in between, but one commonality held across all five students: They could easily differentiate between high- and low-quality coursework.
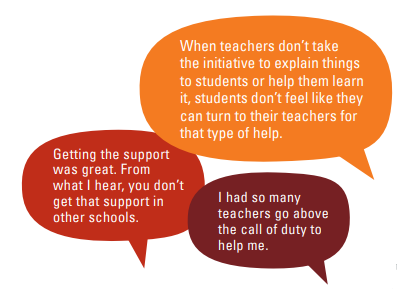
ON SUPPORT AND EXPECTATIONS
Students received different levels of academic support from the adults in their school. Some felt that teachers were always available to help them succeed, whereas others felt their teachers were “there because they had to be.”
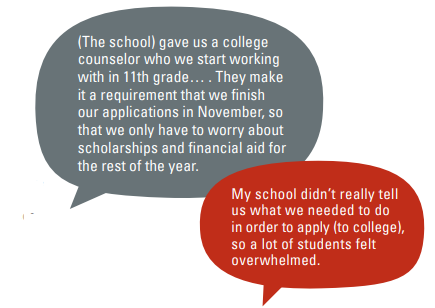
ON APPLYING TO COLLEGE
Despite their high level of incoming preparation, the students received different levels of support from their schools in getting ready for college. Not only did these experiences influence where the students ultimately enrolled in college, but also how prepared they felt when they got there.
Advice for Schools
“Start early.”
The students we spoke to thrived when their high school classes mirrored the expectations in college-level courses. In fact, they were deeply grateful for the opportunities they had in high school to discuss and evaluate ideas with peers, to write at length, and to take challenging assessments.
Students clearly delineated between high-quality courses, which prompted them to think deeply and make connections, and low-quality courses, which simply required regurgitation. Reflecting on his history courses, for example, Andres gives this advice to schools: “It would be better to ask about what a historical event meant in a larger context or what reaction the event had, instead of asking about one specific person. And it’s definitely not easier. It would be easier to just ask students to memorize.”
Students generally wished they had more of these opportunities, rather than fewer, feeling that their demanding high school courses were the ones that most prepared them for college. Rosa, a former student at Columbus Alternative High School, noted, “CAHS gave you a lot of work, but (college) is the same — paper-writing, discussion-oriented classes. They’re comparable.” (See sidebar on the college-going culture at CAHS, page 21.)
“What holds back a lot of students is
people tell them ‘No.’”
Students internalize the powerful messages that adults communicate to them, and many of the students we spoke to reflected on times when adults had made either positive or negative assumptions about them or their peers. For example, looking back on a meeting with his guidance counselor about applying for college, Gregory recalls that the discussion was mostly about “giving you realistic options about what you could major in, looking at your finances, and helping you decide whether to go to a public college or transfer or go straight into the workforce. It wasn’t about helping you find the college that you wanted to go to.” Contrast this guidance, which didn’t even include private college in the realm of possibilities, to Rosa’s experience at CAHS, where educators encouraged all students to apply to selective colleges. She says, “A lot of high-achieving students shy away from applying for opportunities because of the cost … but I have two friends going to Harvard this year, and they got incredible amounts of scholarships because they took the chance.”
Their reflections suggest that students largely perceive the possibilities available to them through the lens of the adults around them. So, educators can deeply influence students by developing and reinforcing their aspirations, regardless of the potential limitations that students face.
Educators are in a position to foster students’ goals and help them to find solutions to potential barriers, rather than simply point them out.
“My adviser was probably the single
greatest resource I had at the time.”
For many of the students, advisers and mentors served in loco parentis when it came to navigating high school bureaucracies and applying for college. This is not because the students lacked supportive and caring parents, but because their parents were often unfamiliar with high school and college landscapes. Reflecting on the experiences of her mostly low-income peers, one student says, “Many parents don’t know what exists or where to start.”
Other students spoke of Young Scholars programming that helped them apply for college: services that could have been offered by the students’ schools, but weren’t. “In the summer before senior year, we had a mock college fair, and we went to interviews with college representatives to help prepare. There were also writing workshops on how to write college essays,” recalls Merrill. At one of those college fairs, Andres remembers that his Young Scholars adviser introduced him to representatives from five different colleges he was considering. His adviser also checked in with him every two weeks to assist with applications, remind him of deadlines, and help with financial aid forms and scholarships.
Research documents that information shortages pose a substantial barrier to low-income students as they apply for college. In fact, a recent experiment that provided high-achieving, low-income students with information about colleges, facts about financial aid, and application fee waivers, found that students who received the information were more likely to enroll in selective colleges or universities than their otherwise similar peers.37
In many ways, the Young Scholars program stepped in to provide opportunities that many affluent students take for granted. But often, the advisers offered guidance or programming that could have been delivered in the students’ own schools. For example, educators can serve as mentors to students, particularly during the college application process, helping students get in touch with college representatives and write essays. While it’s no secret that educators are already strapped with tons of responsibilities, the students we spoke to all emphasized the importance of mentorship, suggesting that time spent talking to students about future plans and helping them access information would be time well-spent.
“Being in an environment with other
students at or above my ability level…
really helped me.”
All students, not just those who are initially high-achieving, benefit from being around adults and peers who challenge them to high levels. Still, most of the students we spoke to mentioned that their peers helped keep them on track. For example, Andres says of the IB program at his high school, “The best part about it was that there were the same people in all my classes. We kind of felt like family.”
Because many educators in low-performing schools believe that high-achieving students are outliers, they can’t conceptualize how to create a peer community for them in a school without a profusion of other high-achieving students. However, most of the students we interviewed attended schools in low-income communities that did not exclusively serve high-achieving students. And yet, some of these schools intentionally cultivated an academically oriented environment that made students feel their peers were high-achieving like them.
CAHS, where Rosa attended, enrolls students with varying levels of preparation via lottery. Rosa is the first to admit that “there are people whose parents send them to (CAHS) even though they don’t want to go.” But, the school maintains an academically focused culture that brings together all students, even those who initially did not want to attend. One of the ways CAHS accomplishes this is by taking sports out of the equation. Instead of offering a sports program, the school engages students through 35 student-led clubs, meaning that “all students fit in and have an academic orientation,” says Principal Wells. Indeed, Amanda Ripley, author of The Smartest Kids in the World — and How They Got There, notes that sports are de-emphasized in other high-performing countries, signaling to students that the purpose of school is purely academic.38
Of course, there are other ways to endorse an academic focus besides removing sports. Ashley, who attended a high-performing charter school in Texas, said her school was “determined to get all kids into college,” and as such, they treated all students as college-bound.
Creating a college-going culture is a leading strategy for ensuring that high-achieving students are not isolated in their school community. (See sidebar: College-Going Culture at CAHS). In fact, research consistently indicates that successful high schools work to build this type of culture. For instance, a recent study of 325 high-achieving black and Latino males attending small New York City high schools found that the students felt their high schools were “like a small college.”39 Schools generally did this by forming positive relationships with students and closely monitoring them as they progressed through school and applied for college. For instance, one of the schools put up a giant bulletin board that tracked each student’s journey to college. The bulletin board visually depicted whether each student took the SAT, applied to colleges, filled out the FAFSA, and had been accepted to a college.
So, when educators cohesively communicate college-going expectations to all students, they create a community where students feel they can support each other in their academic goals.
Data Appendix
The charts below show the data discussed in the report. The following terms are used in the charts:
• Initially low-achieving: Students who scored in the bottom quartile on the ELS reading and math assessment
• Initially high-achieving: Students who scored in the top quartile on the ELS reading and math assessment
• Low-SES: Students within the bottom quartile of a socioeconomic status index that measures a student’s family
income, parental education, and parental occupational prestige
• High-SES: Students within the top quartile of a socioeconomic status index that measures a student’s family
income, parental education, and parental occupational prestige
Significance tests tell us whether two values are truly different, meaning the difference does not occur as a result of mere
chance.40 The tables below have been marked with colors to reflect significant differences between groups. Initially highachieving
students, white students, and high-SES students are the reference groups, meaning that cells are color-coded
when they differ significantly from these groups. The following colors were used:
![]()
All values have been weighted to reflect the full population of students, as opposed to just the students who were selected
to participate in ELS.41 Values may not sum to 100 percent in all charts because of rounding.