Equal Talents, Unequal Opportunities: A Report Card on State Support for Academically Talented Low-Income Students

Dr. Jonathan Plucker / Dr. Jennifer Giancola / Grace Healey / Daniel Arndt / Chen Wang
01

Executive Summary

Year after year, in every state and community in our nation, students from low-income families are less likely than other students to reach advanced levels of academic performance, even when demonstrating the potential to do so. These income-based “excellence gaps” appear in elementary school and continue through high school. It is a story of demography predetermining destiny, with bright low-income students becoming what one research team referred to as a “persistent talent underclass.”

Low-income students, recently estimated to be roughly half of our public school population, are much less likely to achieve academic excellence or, when identified as high-ability, more likely to backslide as they progress through school. Recent studies highlight the numerous educational advantages students in higher-income families receive, from hearing more vocabulary words from their parents to taking part in extracurricular activities and attending schools with more experienced teachers and smaller class sizes. In light of these disparities, schools can play an important role in equalizing opportunities. Through educating the nation’s youth, our schools cultivate our next generation’s talent, and students who do well in school are more likely to become productive contributors to society. By setting state-wide policies encouraging excellence, states can encourage all schools to provide advanced learning opportunities for high-ability students.

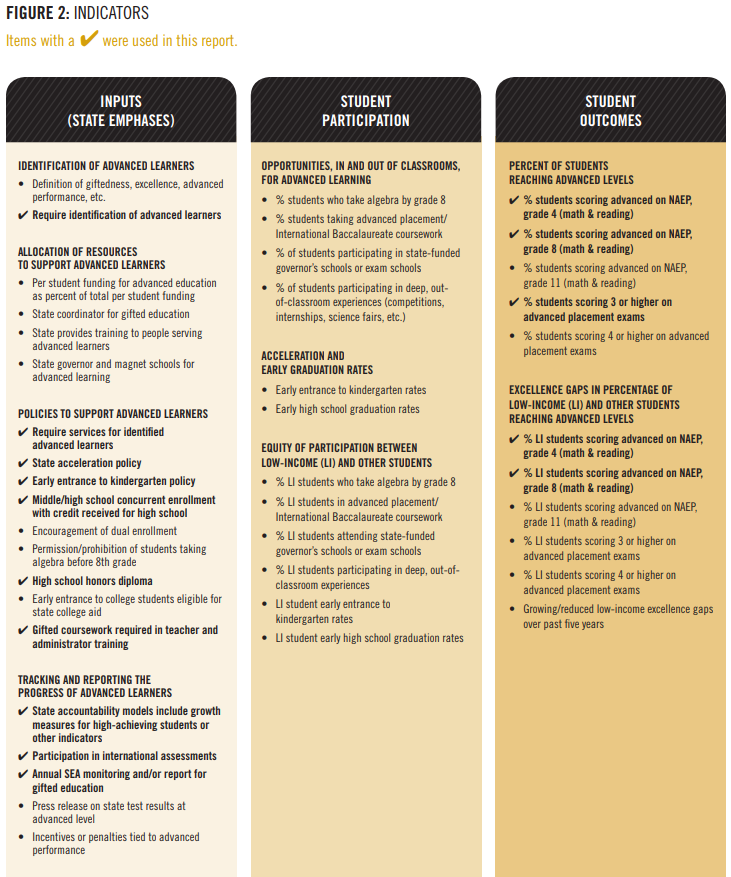
This report examines the performance of America’s high-ability students, with an emphasis on those who come from low-income backgrounds. The report examines a range of state-level interventions that are intended to foster academic talent, with the goal of identifying the policies currently in use that should be implemented more widely. Working with an expert advisory panel, the project team identified a range of indicators related to state-level policy inputs and student outcomes. Ultimately, 18 indicators were included in the analyses, representing nine distinct state-level policies and nine specific student outcomes. All data were collected at the state level, as we believe that changes to state-level policies are most likely to improve the country’s education of high-ability students, especially students from low-income families. States were then graded on both their policy interventions and their student outcomes.

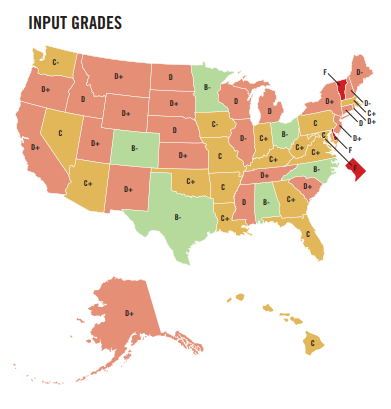
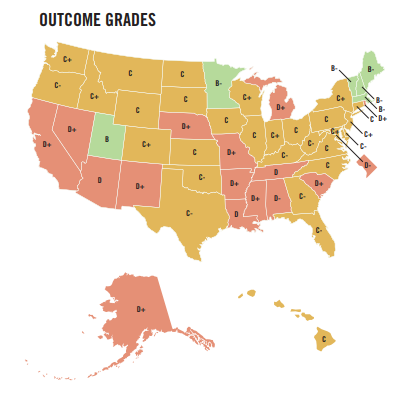
The initial results (see maps on page 2, larger maps on pages 7-8) are not encouraging. Few states have comprehensive policies in place to address the education of talented students, let alone the education of high-performing students from low-income families. In this state policy vacuum, support for advanced learning rests on local districts, schools, and families. The opportunities available to low-income students are decidedly restricted and limiting.

Without significant differences in state interventions to support advanced education, student performance outcomes at the advanced level appear to be normally distributed across states—as one would expect in the absence of attention to talent development. Our data suggest a correlation between state demographics and outcomes— higher poverty states tend to have lower outcomes. Not surprisingly, large excellence gaps (differences in performance between low-income and other students) exist in nearly all states.

This is both unacceptable and incompatible with America’s long-term prosperity. The vibrancy of our economy depends on intellectual talent, our quality of life is enriched by it, and the moral code of our society is based on the free exchange of creative ideas. We must ensure that talent is developed equally in all communities, starting with ensuring that all students have access to advanced educational offerings.

Yet there are reasons for optimism. Talent development is becoming a concern of policymakers, and many of the necessary policies identified by the expert panel and in the research literature are relatively low cost and easy to implement. Several states lead the nation in producing higher percentages of talented students, and many states appear to have the structures in place to begin addressing student talent development more effectively.

To help states build on this groundwork, the Jack Kent Cooke Foundation plans to conduct this survey periodically, with an increasingly broadened set of indicators and data sources, to inform the national dialogue about how best to educate our most advanced students, especially those from low-income families. As a starting point, we offer the following recommendations to states:

RECOMMENDATION 1:

Make high-performing students highly visible.

Require local education agencies (LEAs) to identify high-ability students and their income levels and collect data on their performance over time, especially those who are low-income. When releasing state data on student outcomes, ensure that the performance of high-achieving students is highlighted.

RECOMMENDATION 2:

Remove barriers that prevent high-ability students from moving through coursework at a pace that matches their achievement level.

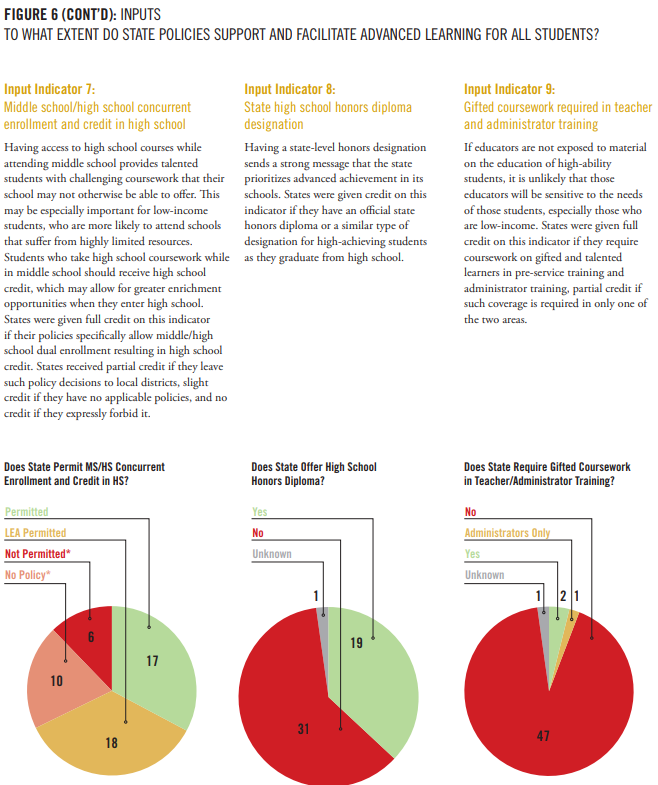
Require LEAs to allow and encourage a range of academic acceleration options, such as early entrance to kindergarten, acceleration between grades, dual enrollment in middle school and high school (with middle school students able to earn high school credit), and early graduation from high school.

RECOMMENDATION 3:

Ensure that all high-ability students have access to advanced educational services.

States can and should take the lead in promoting educational excellence. Require services for gifted and talented students, require all educators to have exposure to the needs of advanced students in teacher and administrator preparation coursework, and monitor and audit LEA gifted and talented programs for quality. Increase opportunities for dual enrollment and AP courses.

RECOMMENDATION 4:

Hold LEAs accountable for the performance of high-ability students from all economic backgrounds.

State K-12 accountability systems often drive the discussion of priorities in local school districts, and those systems should include measures of growth for high-ability students and other indicators of excellence, including distinct indicators for high-ability, low-income students.

02

Introduction

The lack of academic success of high-ability, low-income students should be among the country’s most pressing education and policy issues.1 Conventional wisdom has it that smart, poor students “can write their own ticket,” yet a growing body of research offers evidence that these students are not succeeding at anything close to the rate of their high income peers. Lacking access to the enriched academic opportunities, differentiated learning, and counseling afforded to wealthier students, high-ability, low-income children are becoming what one leading team of researchers has termed a persistent talent underclass—underserved and therefore prevented from fully developing their talents.2

Although systematic efforts to address known problems with educating minority students have resulted in narrowing racial achievement gaps, the performance of the most talented low-income children lags far behind that of their high-ability, higher-income peers. In fact, the gap between these groups of students (the “excellence gap”) has grown substantially over the past generation.3 Since recent studies have shown that low-income students constitute over 50 percent of the student population in many states,4 the inadequacy of educational policies for such a large group of students has enormous implications for social mobility, preservation of the American Dream, and the nation’s future economic prosperity. Without more deliberate focus on this issue, our education system will become an unwitting accomplice to the nation’s growing income inequality.

Purpose of this Report

The Jack Kent Cooke Foundation has been committed since 2000 to supporting the talent development of high-ability students with financial need. The Cooke Foundation funded this state-by-state analysis to measure state policy support for advanced learning and highlight disparities in educational outcomes of advanced learners from low-income families. This report measures the extent to which states are addressing the needs of advanced learners, identifies best practices that states may adopt, and collects in one place critical data suggesting which interventions have the greatest efficacy. To maximize this report’s usefulness, states were rated on policies they have in place (“inputs”) and how high-ability, low-income students currently perform (“outcomes”).

What We Did

Our goal for this research was to illustrate the excellence gap using indicators that were readily available, easily understood, and comprehensive. We wanted to create a report that would provide clear guidance to states on how they might better support advanced learning for all students, by implementing policies to insure that all high-ability students—including those from low-income backgrounds—have the supports they deserve.

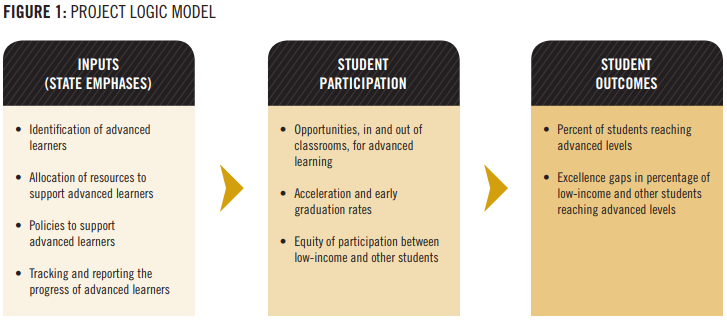
We began the project by convening an expert advisory board of national experts familiar with the landscape of state policy as it relates to advanced learning.5 Following a series of email exchanges and conference calls, the project team compiled a master list of indicators that could be used to evaluate the extent to which state-level policy inputs are in place, the degree to which students are participating in targeted interventions, and student success in attaining advanced levels of achievement. The project team took this extensive list of indicators and developed a logic model for the project, so as to inform this and subsequent versions of this report (Figure 1, below). We selected 18 of these indicators to be included in this first version of the report, based on data availability and ease of access (Figure 2, page 5).6


03

Methods and Limitations

Project staff compiled a database to record each variable for each state plus the District of Columbia. Data were drawn from numerous online and documentary sources.7 When critical data were missing, project staff contacted state education agency (SEA) staff directly, and if that effort was unsuccessful, we used data from earlier versions of the targeted data sets. These cases are marked in the data set (Appendix B, pages 24-32).

Much of the policy data are self-reported by SEA officials on various surveys. Self-reported data have well-known limitations, but the consistency of responses across the past few administrations of the surveys, in combination with random checks of the responses by the research team, provide a level of confidence in the reliability and validity of those data. The biggest limitation of this report is the lack of available data on the education of advanced students, especially as it relates to excellence gaps and low-income students and their families. Many of the indicators recommended by the expert panel were not readily available, and in some cases the data of interest do not appear to be publicly available.8

In the following section, each variable is described along with our findings of the extent to which states have implemented these inputs and achieved these desired outcomes. Appendix A (pages 22-24) contains detailed descriptions of each indicator and how states were graded. Variables that were not readily available, or which were excluded due to data quality issues that emerged during the data collection process, are described at the end of each Appendix A subsection.


04

Results

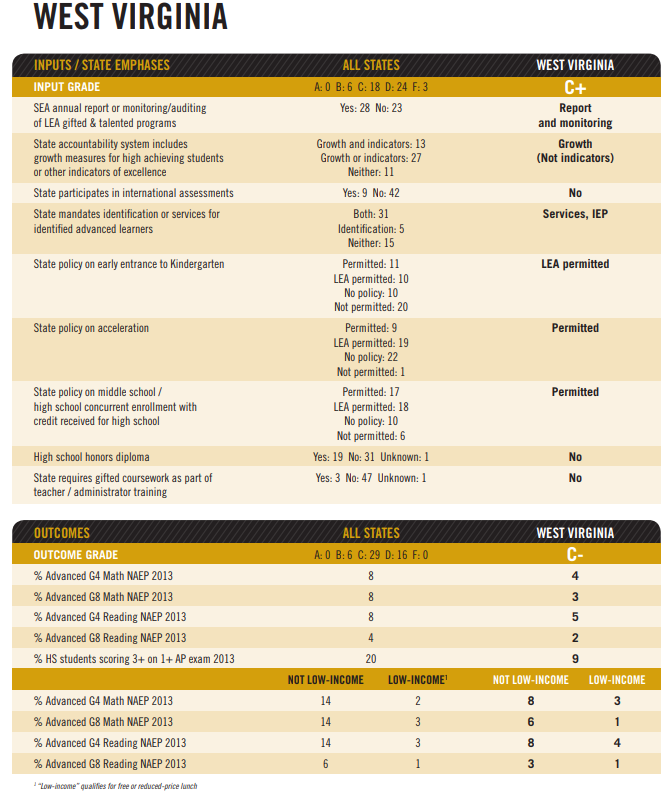
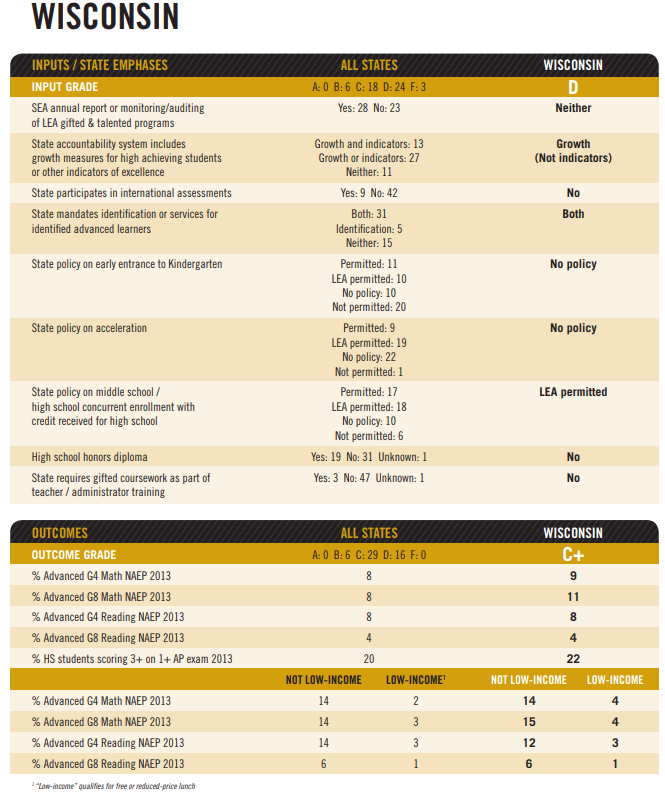
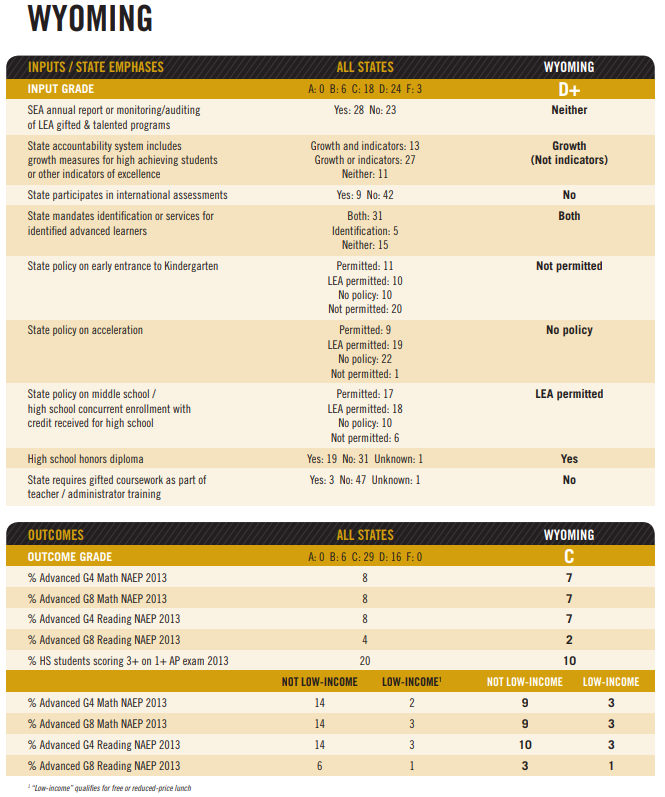
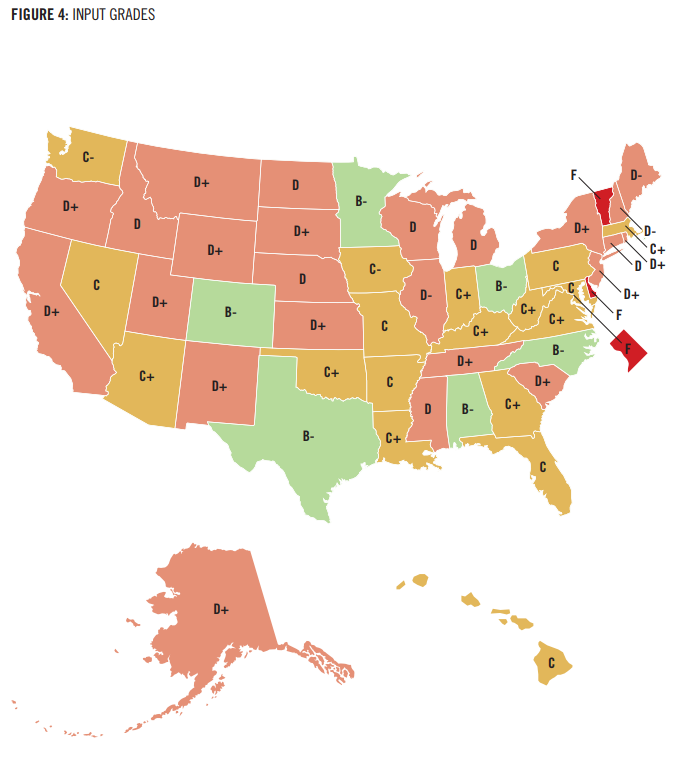
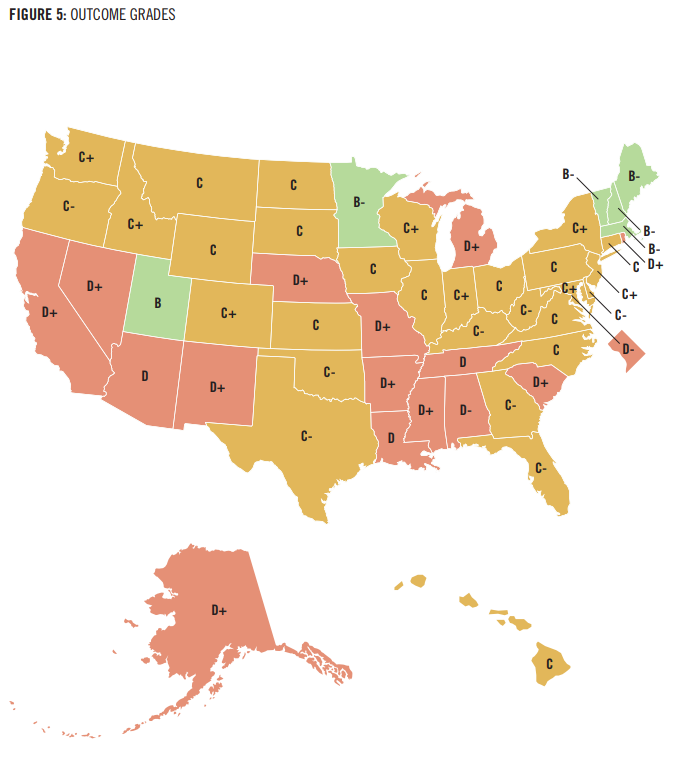
Figures 4 and 5 (pages 7-8) present the individual state grades for inputs and outcomes. Individual indicators are described in detail in Figures 6 and 7.

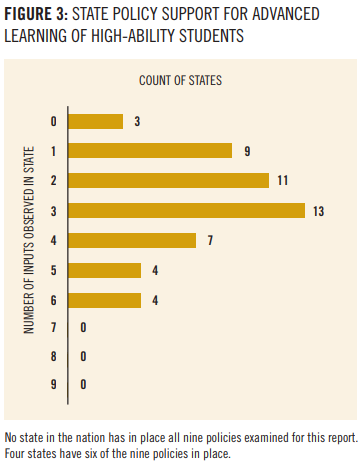
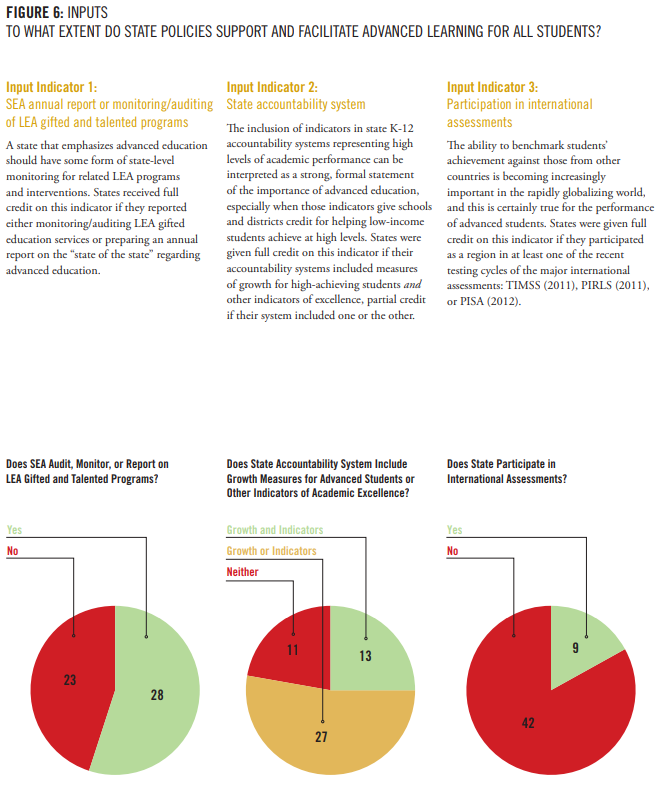
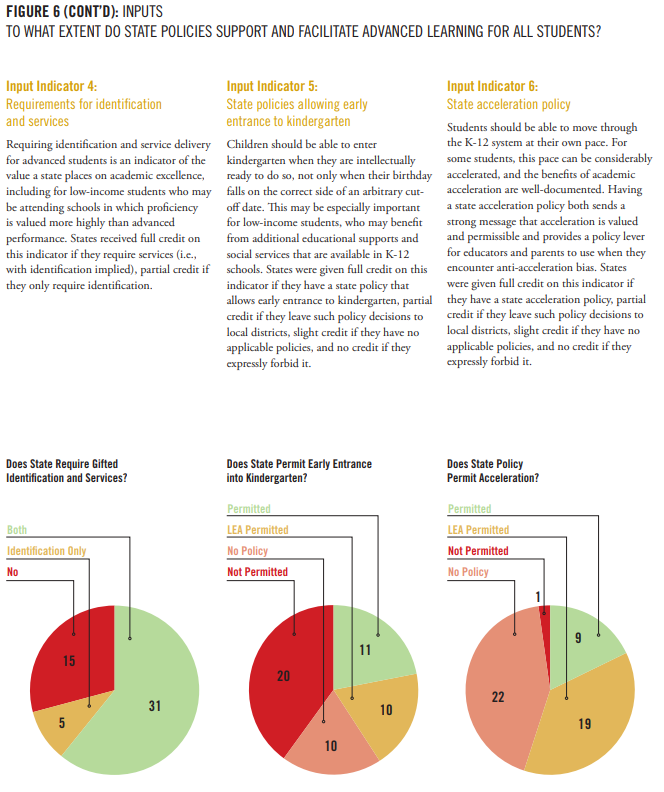
Collectively, the 50 states and D.C. report a range of policy positions and accountability measures for advanced learning. No states currently have in place even seven of the input indicators we examined, let alone all nine (Figure 3, right). More than half (28) of the states require the identification and service of high-ability students, and an equal number annually report or monitor those services. But policies that would formally allow students to progress faster than normal (by entering kindergarten early, accelerating grades, or graduating early) appear in fewer than half of the states. On average states have implemented three of the nine indicators we examined.

Student performance outcomes are similarly mixed. Fewer than one-third of states report significant percentages of their public school students reaching advanced levels in achievement. Only a handful of states received full or nearly full points on the excellence gap measures. In many cases, these states had low overall levels of advanced performance, creating an artificial ceiling on their excellence gaps.


05

What We Learned

Five basic lessons about how the states address excellence gaps emerged from the research. Collectively, they describe a system that is not focused on the high-achieving student and overlooks research suggesting the particular fragility of low-income, high-ability children.

  1. In most states, attention to advanced learning is incomplete and haphazard.

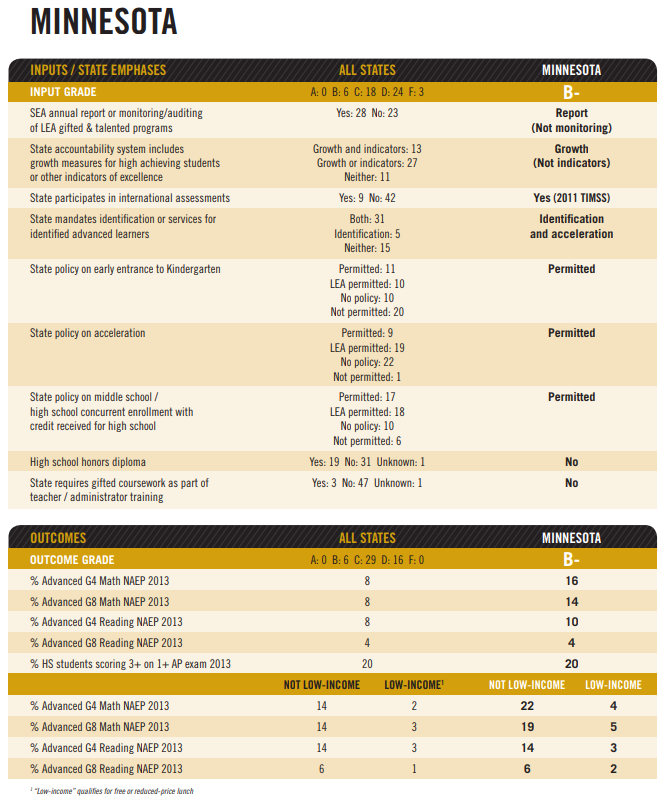
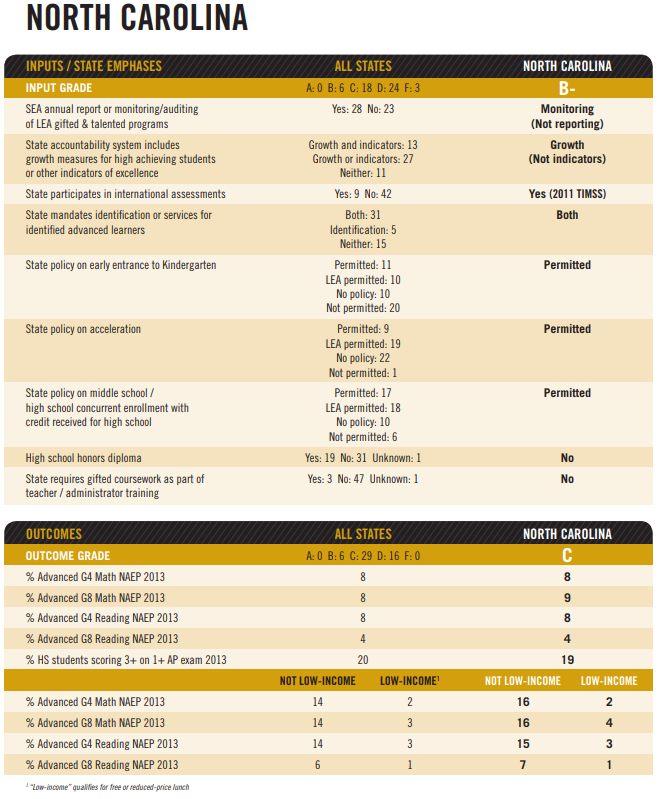
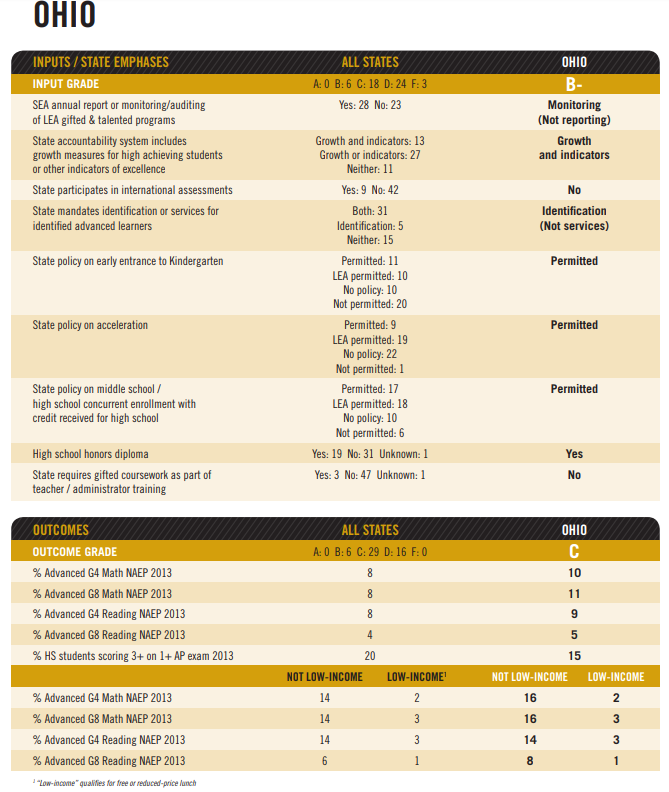
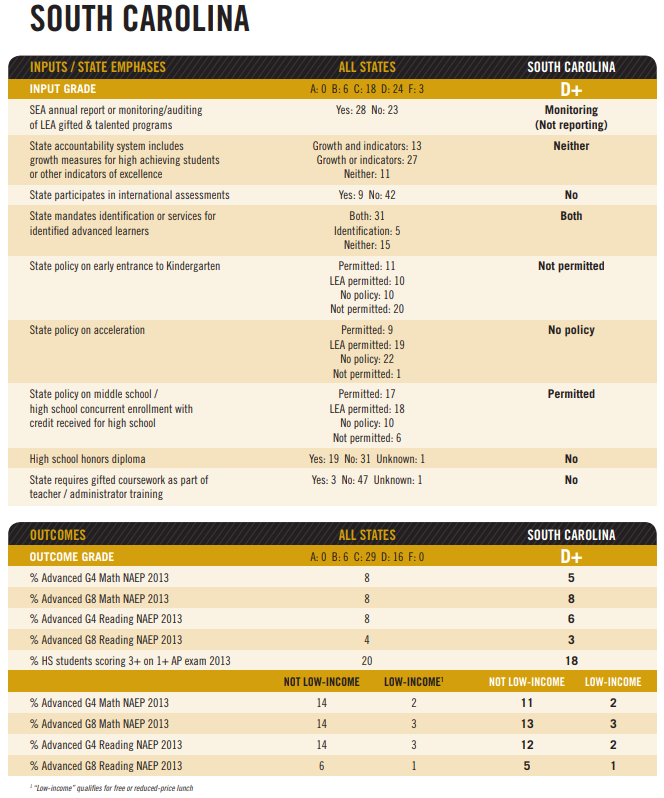
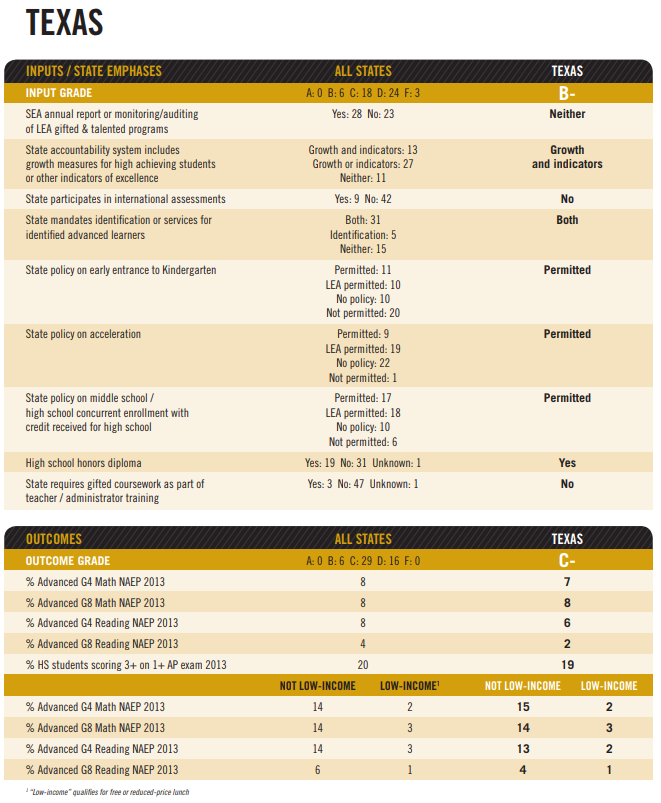
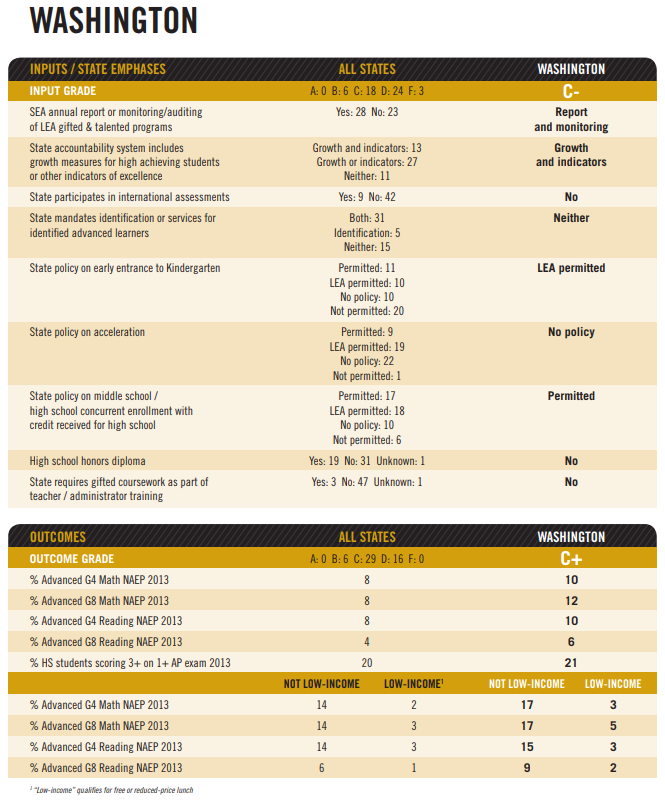
Variation among states was substantial. We hoped to identify patterns of support, with some states doing much more than others. What we found instead was each state hit some indicators but not others. For example, South Carolina requires identification and services for advanced learners, but has no measures of academic excellence and advanced student growth in its state accountability system. Washington has state-level monitoring and auditing of local education agency gifted and talented programs, but does not require instruction on working with gifted students to be included in teacher and administrator training programs. We found only four states (Minnesota, North Carolina, Ohio, Texas) with policies that explicitly permit early entrance to kindergarten, grade acceleration, and concurrent middle school/high school enrollment with credit for high school—yet all but four of the remaining states have policies in place permitting at least one of these modifications for advanced learners, either state-wide or at the local education agency level.

There were stand-out policy strengths in some states: inclusion of student growth indicators in state accountability systems, requirements for gifted education identification and services, and allowing for acceleration (see “Promising Examples” section, page 16). However, for any given policy, between a quarter to three-quarters of states forbid these accommodations, do not have policies addressing these issues, or leave decisions about specific interventions to the discretion of local districts. This has resulted in a patchwork of services that we suspect benefits primarily students in wealthier districts.

  1. In the absence of comprehensive policy support for advanced learning, economic conditions appear to drive outcomes.

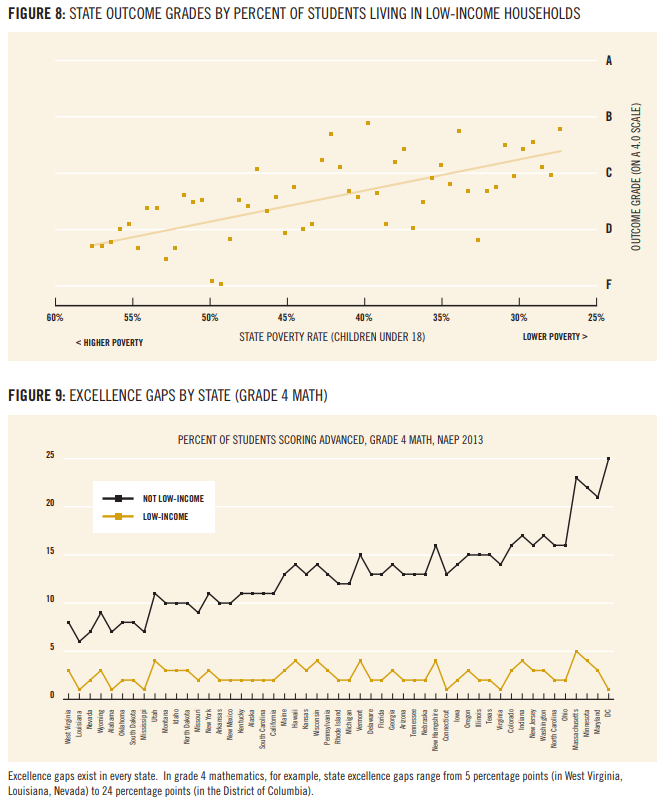
Policy support for advanced learning was weak in the vast majority of states. Given that finding, it was not surprising that the inputs and outcomes used in this study are not highly correlated. In other words, there is not enough policy work with which the outcomes can be correlated. Given this limited attention, support for advanced learning becomes primarily a function of school and student resources. This trend is especially noticeable at the lowest and highest ends of the poverty spectrum; states with very high (or low) percentages of children living in low-income families have correspondingly low (or high) performance outcomes (Figure 8, page 15).

  1. Although some states have impressive outcomes for their high-performing students, no state can claim impressive performance outcomes for students from low-income backgrounds.

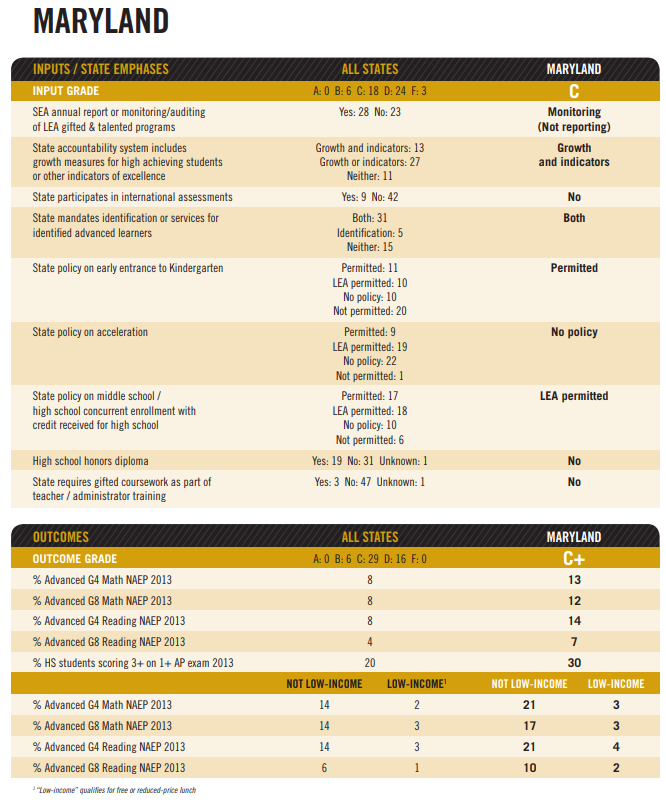
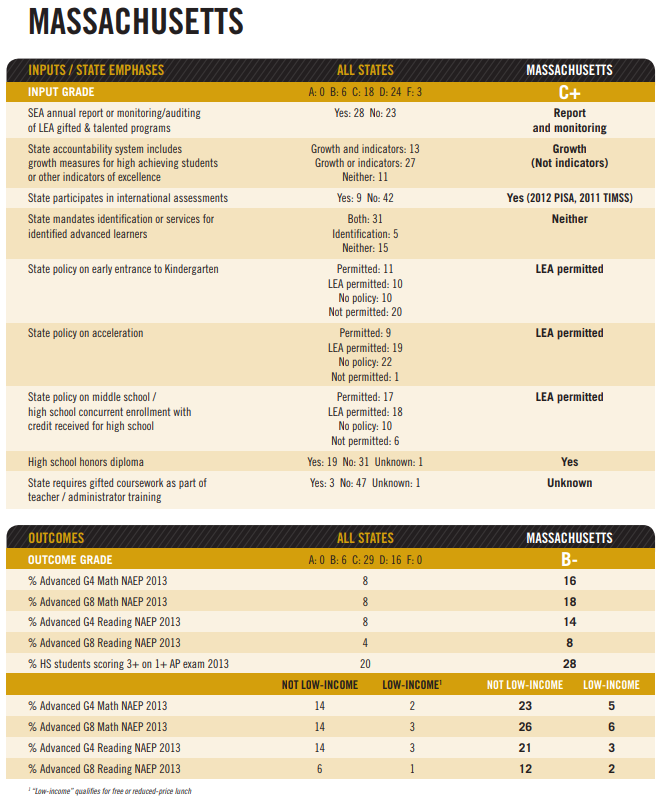
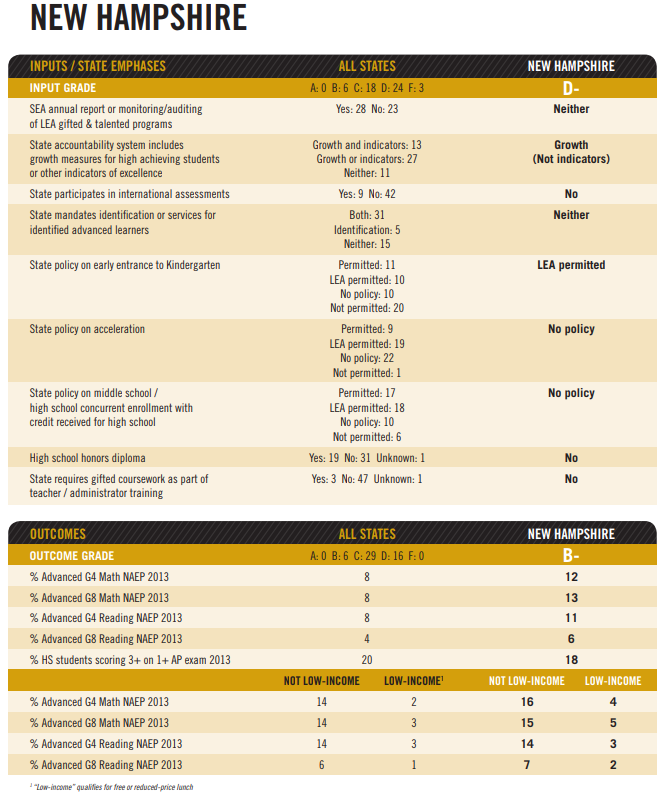
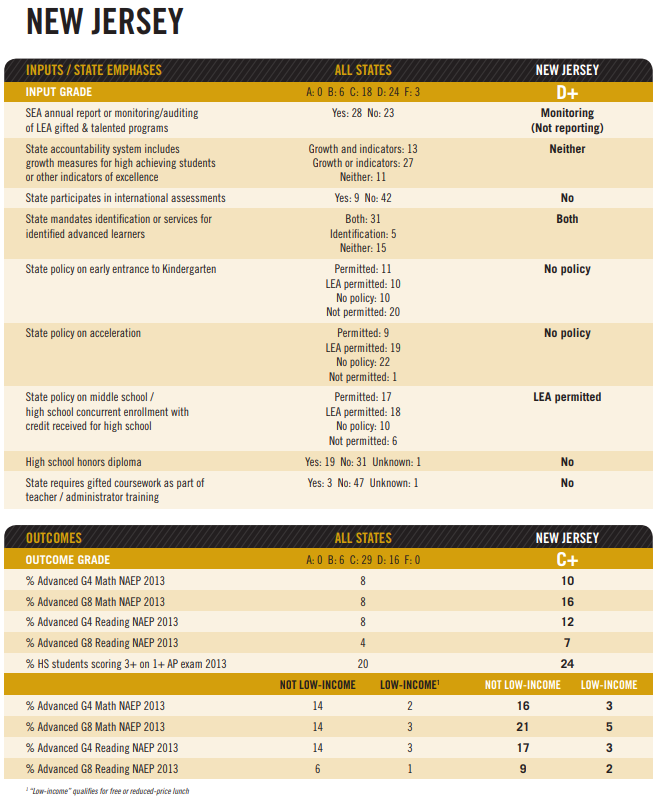
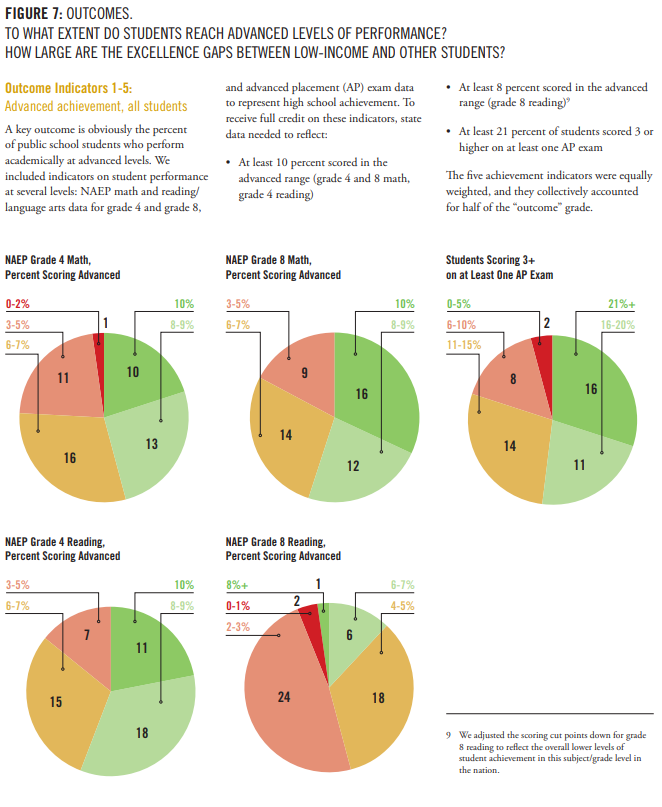
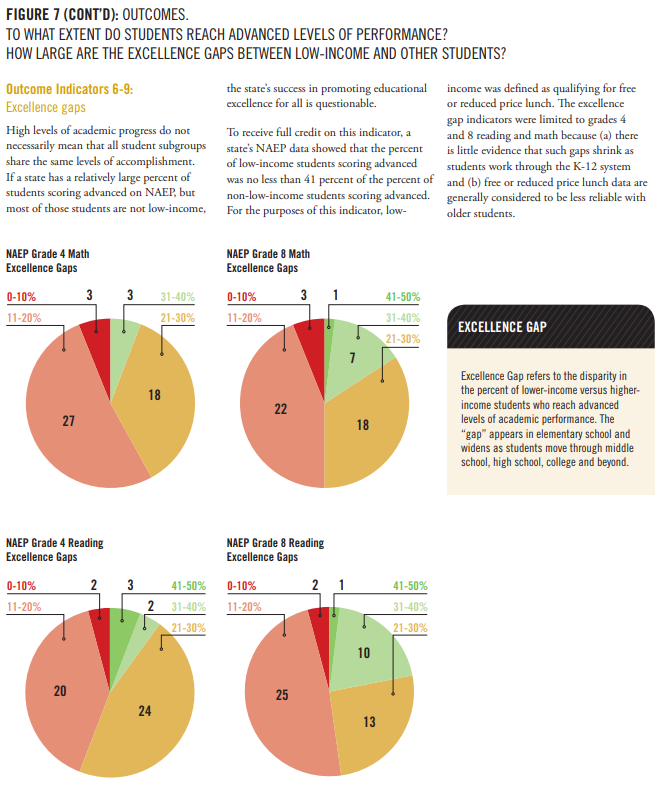
Several states have been successful in getting relatively large percentages of their students scoring “advanced” on NAEP tests and AP exams. Massachusetts, Maryland, New Hampshire, New Jersey, Vermont, and Washington did especially well in this regard, with several other states’ students performing at reasonably high levels. This is important and laudable, but we were disappointed at the large size of the excellence gap in all states. For example, Massachusetts clearly leads the nation in the percentage of students scoring advanced on NAEP, with 18 percent (!) of their students scoring advanced on the grade 8 math assessment. Massachusetts deserves credit for that exceptional performance. However, that success is driven primarily by the performance of higher-income students: Only 6 percent of Massachusetts students qualifying for free or reduced-price lunch scored advanced, compared with 26 percent of all other students. Although 6 percent is much better than the national average (and our grading system took this into account), the 20 percentage point gap between these groups of students remains staggering.

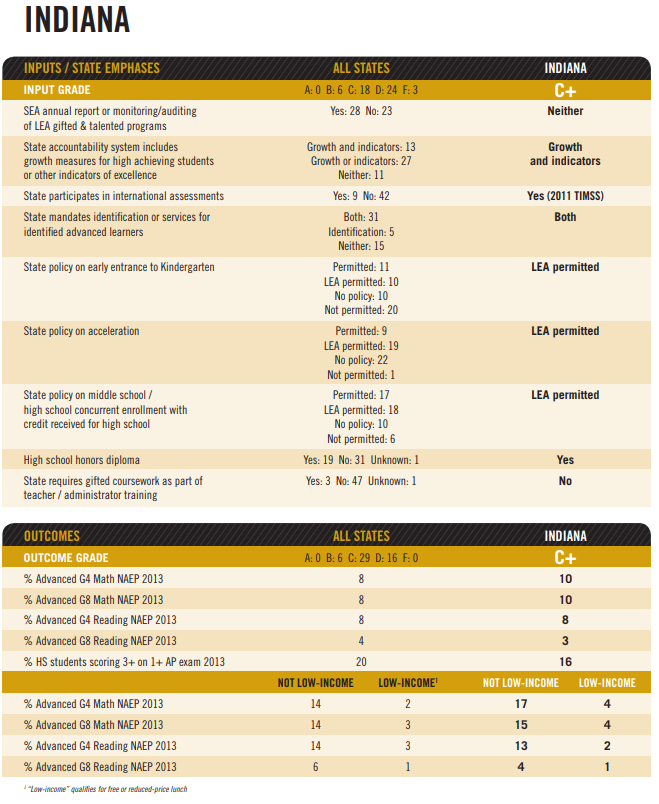
A more typical example is found in Indiana, with 8 percent of students scoring advanced on the NAEP reading test at grade 4. That is solid but not exceptional performance, and when its excellence gap is examined, only 3 percent of low-income students scored advanced while 13 percent of other students did.

The size of a state’s excellence gap does not correspond with its overall performance. Small proportions of low-income students score “advanced” in all states. Thus states with lower levels of overall advanced performance often have smaller excellence gaps, because the performance of their higher-income students creates a lower ceiling for the gaps (Figure 9).

  1. Data describing advanced performance are not readily available.

Although some states report on advanced performance for all students, no state has a comprehensive system for tracking high-performing, low-income students. We wanted to include multiple measures of advanced performance and the excellence gap—for example, number of students taking algebra by grade 8, performance of low-income students in AP courses, students graduating early from high school—but could not obtain the data. We also wanted to include measures not just of outcomes but also student participation (see the logic model in Figure 1) but were unable to find any reliable measures of student participation for this first iteration of the report card.

Although we will collect additional data directly from states in subsequent iterations of this report, we believe all states should report on the advanced learning of their students (overall, and by income level), by implementing comprehensive annual monitoring and reporting on programs designed to promoted advanced education that includes multiple measures. Without clear and readily accessible data, we cannot assess where we are and which direction we should be going.

  1. All states could do more to support advanced learning.

No state received full points in either policy inputs or student outcomes, which left us unable to give any state an ‘A’ grade. This was obviously disappointing, made more so by the fact that we thought we had set a relatively low bar for many of the indicators. For example, we did not look at how policies were being implemented, or the number of students being impacted by each policy; we focused instead in this first report simply on the existence of relevant policies. On the outcomes side, we gave states full credit for progress toward eliminating excellence gaps if their low-income students performed roughly half as well their wealthier peers, even though the ultimate goal is equity across all groups. As a result, grades were disappointing on both sides of the ledger. Table 2 presents the grades by state for inputs, outcomes, and the percent of children under age 18 living in low-income households.

Yet there is hope. No state received a failing grade for policy inputs and student outcomes. All by three states had at least one policy in place to help advanced learners thrive. There is just more—so much more—they could do. In the next section, we highlight ways a few states are creating opportunities for advanced learners to soar.

06

Promising Examples

Minnesota is the highest scoring state, receiving a B- grade for both inputs and outcomes. It has state-wide policies in place permitting early entrance to kindergarten, acceleration between grades, and concurrent enrollment in middle school and high school (with credit received in high school). They require that high-ability students be identified and supported with services, and they report on the outcomes of their high-performing students. Minnesota is one of nine states that participated in an international assessment in recent years (the 2011 Trends in International Mathematics and Science Study). Administrators in Minnesota’s Department of Education are clearly thinking about advanced education. There is a “Gifted Education” page on the DOE’s website, a Gifted and Talented Advisory Council meets quarterly, and the state produces an annual report on its advanced learners. Minnesota’s B grade comes from the fact that it could do more to recognize its advanced students and hold its educators accountable for serving them. In addition, it does not offer a state-level honors high school diploma, and it does not require educators to receive training about high-ability students.

Regarding outcomes, Minnesota—with one of the lowest rates of children living in low-income households in the nation, at 32 percent—not surprisingly reports high levels of advanced performance overall. For example, 14 percent of Minnesota’s eighth graders score at the advanced level on the NAEP math assessment. Yet its excellence gaps between low-income and other students are significant. In eighth grade math, for example, only 5 percent of low-income students reach the advanced level (compared with 19 percent of all other students). To receive an ‘A’ in outcomes, these excellence gaps need to narrow significantly.

To gain a better understanding of the Minnesota context, we spoke to colleagues who have worked in Minnesota public K-12 education for many years. They gave substantial credit to the state department of education’s gifted education consultant. As one long-time educator and consultant noted, “The specialist has had a strong impact on serving gifted students and nurturing the gifts and talents of children in poverty. She’s been an absolute champion and deserves a lot of credit.” This person also noted the state department specialist has significant political and educational skills, making her an ideal leader for creating state-level policy change and generating statewide educational impact. Sources also credited the strong state education department leadership who work in concert with local educators and higher education professors. They “brought lots of expertise to the table and created a synergy that led to some real change.” We were also told that the state has a strong focus on addressing problems caused by poverty, in general and within gifted education contexts. This observation—that strong SEA leadership and university support are critically important—was a theme across the relatively high-scoring policy input states.

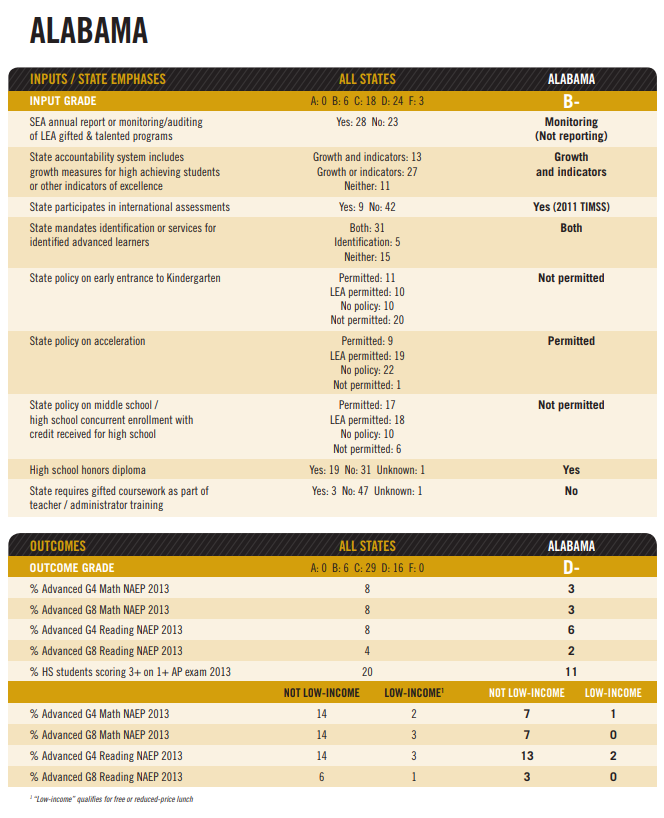
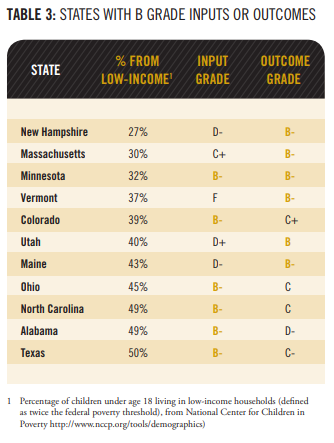
In addition to Minnesota, 10 other states received a B grade in either inputs or outcomes. We observe that states with fewer low-income students are more likely to score highly on outcomes (Table 3, below). There are a few states, however, with large poverty populations that are doing better than most: Ohio, North Carolina, Alabama, and Texas. We note that the states with the best student outcomes have a wide range of policy grades but also relatively low percentages of low-income students. This suggests that states that are not implementing pro-excellence policies may be achieving their relatively high outcomes, at least in part, due to favorable demographics. At the same time, many of the best input grade states have poor outcomes and relatively high levels of student poverty, suggesting that these states are trying to move in the right direction to change the outcomes.

Ohio gives concrete attention to advanced education in its accountability system, attention which may address excellence gaps. Ohio has a defined Gifted Indicator (see box, page 19) that holds schools accountable for identifying gifted students, serving them, and monitoring their growth. There is not an explicit focus on the excellence gap in this Gifted Indicator. However, all schools are required to complete an annual self-report in their identification and services for students who are gifted, which does include a section titled “Efforts to Promote Equity in Gifted Identification and Services.”10 Yet there is no focus on the excellence gap in this scoring, and this lack shows in their outcomes—14 percent of Ohio’s wealthier students score advanced in fourth grade reading, but only 3 percent of their low-income students.

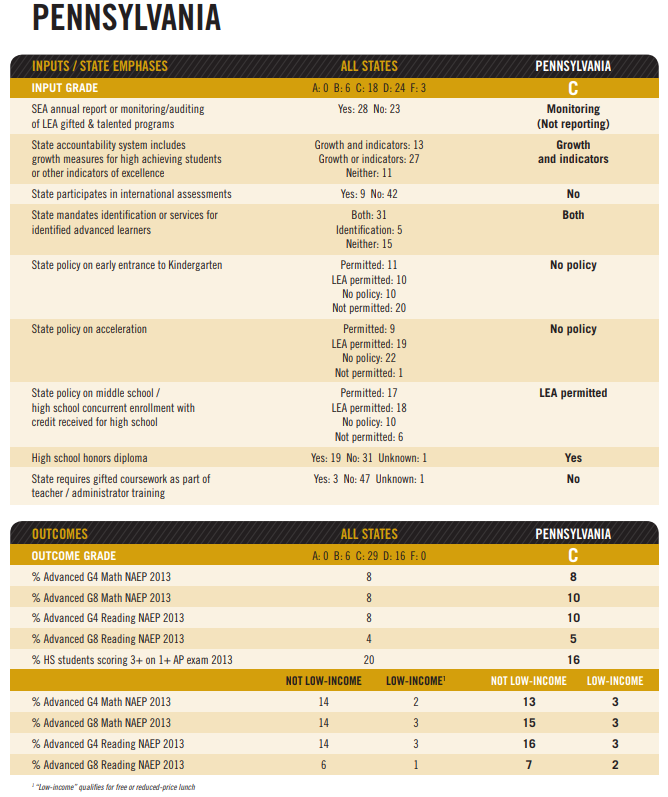
Pennsylvania is in the top half of states for both grades, however receiving only a ‘C’ for both “inputs” and “outcomes.” They have measures in their state accountability system to track high performance and they monitor their gifted and talented programs; they permit local education agencies to decide if they allow concurrent middle school and high school enrollment with high school credit and offer an honors diploma; but they do not have state policies on early entrance to kindergarten or acceleration. With one of the nation’s lower poverty states (39 percent of their students are low-income), Pennsylvania’s overall advanced performance levels are relatively high—10 percent of students in the grade 4 scored advanced in reading, for example. However, their excellence gaps between low-income and other students are pretty large; in grade 4, 16 percent of wealthier students scored advanced on reading compared with only 3 percent of low-income students. There is much more Pennsylvania could do on the policy front, including creating state-wide policies around acceleration and not leaving things up to LEAs. A hopeful sign is that Pennsylvania’s newly elected governor, Tom Wolf, included explicit plans to provide more funding to high poverty schools in an effort to “close achievement gaps between low-income and their wealthier peers” in his election platform.11
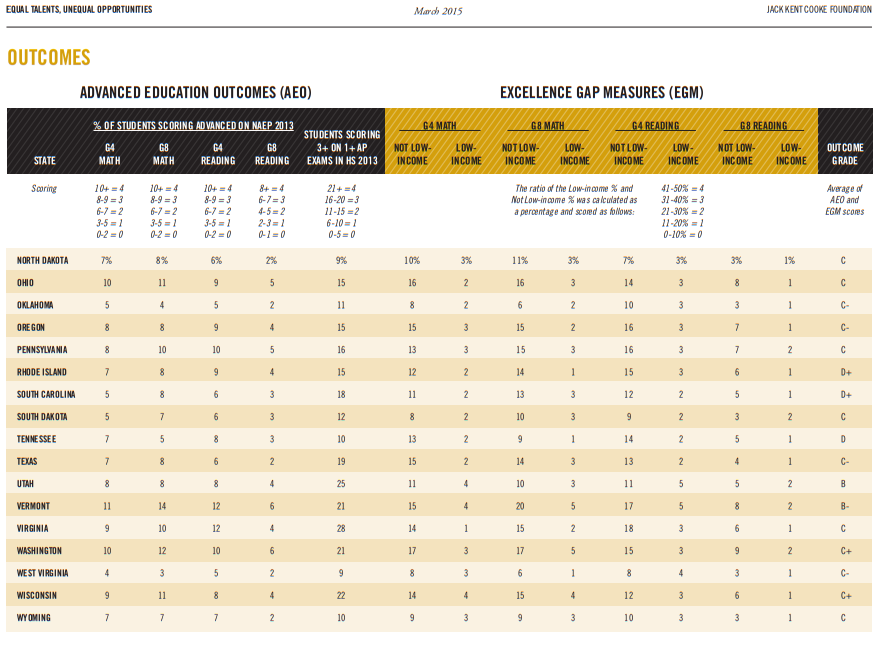
 

07

Recommendations for States

RECOMMENDATION 1:

Make your high-performing students highly visible.

We strongly believe that the root of the problems in the U.S. with advanced student performance is that these students are rarely discussed in state-level policy. As Plucker et al. (2013) note, this lack of discussion makes these students invisible, yet their progress is of considerable social and economic importance to our communities. States should require LEAs to identify high-ability students and their income levels, and collect data on their performance over time.12 At the minimum, SEAs should write and disseminate an annual report on the performance of their advanced students and how LEAs are addressing students’ needs. When reporting annual achievement test results or results of participation in international assessments, states should specifically note the performance of advanced students, especially those who are low- income.

RECOMMENDATION 2:

Remove barriers that prevent high-ability students from moving through course work at a pace that matches their achievement level.

Allowing high-ability students to move through the K-12 system at their own pace is one of the easiest and most straightforward interventions. State-level laws and policies should require LEAs to allow early entrance to kindergarten, acceleration between grades, dual enrollment in middle school and high school (with high school credit), and early graduation from high school.

RECOMMENDATION 3:

Ensure that all high-ability students have access to advanced educational services.

States can and should take the lead in promoting educational excellence. Require services for gifted and talented students, require all educators to have exposure to the needs of advanced students in teacher and administrator preparation coursework, and monitor and audit LEA gifted and talented programs for quality. Provide for dual enrollment for high school students in college level coursework either in local cooperating higher educational institutions, providing AP courses or facilitating dual enrollment in bricks-and-mortar and online college courses.

RECOMMENDATION 4:

Hold LEAs accountable for the performance of high-ability students from all economic backgrounds.

State K-12 accountability systems often drive the discussion of priorities in local school districts. Include in state accountability systems measures of growth for high-ability students and other indicators of excellence, identifying separately low-income and other students.

08

Conclusion

The data indicators used in this report are the so-called “low hanging fruit.” They were chosen because they were (relatively) easy to collect and compile. They also represent steps which all states can take to support advanced learning, without significant additional effort or cost. Some of these policy interventions may actually save states money, e.g., permitting acceleration moves students through the system more quickly, thereby reducing the number of years a student receives educational services.13 Yet even easy-to-implement policies such as permitting acceleration are not universal. Rather, we repeatedly found that very smart students from all income backgrounds are largely being ignored. Although conventional wisdom holds that the United States has moved away from the traditional, “one size fits all” model of education, states are not creating systems that will allow advanced students to move through the grades at a developmentally appropriate pace. Individualized learning programs, which theoretically would benefit high performers from all income brackets, are simply not yet in place. Very few states require that exceptionally high performing students have an Individual Educational Plan, which is required for special education students.

Our most vulnerable high-ability students are paying a steep price for this policy silence. Students from higher-income families are more likely to live in districts where services are valued and provided; and if not, they are more likely to have families that seek out supplemental services such as afterschool, weekend, and summer programs or leave public school entirely to pursue advanced instruction in private schools or through homeschooling. Those students are more likely to perform at advanced levels regardless of state-level policy support; low-income students are much less likely to do so.14 That high-ability, low-income children disproportionately fall behind is not surprising; nor is it adequately documented or squarely addressed.

The Cooke Foundation intends to conduct this study regularly. The current set of indicators will be updated, and future iterations will include surveys of state education agencies so as to broaden the range of indicators that may be included. Our intention to refine the analysis is, of course, no reason to delay action; children go through their public school experiences once.

The alternative—to accept the excellence gap as inevitable—is a recipe for long-term social and economic decline. The country recently reached the point where roughly half its students are low-income. As suggested by the evidence of the extraordinary support that better-resourced families can provide their children, ever fewer high-ability low-income students are performing at advanced levels.15 If those two trends continue, it is reasonable to question how the United States will satisfy its insatiable need for talent. We are laying the groundwork for a persistent talent underclass. In the final analysis the problem is stark: if we fail to reduce the barriers to excellence for talent development of our brightest students, our economic preeminence will be fundamentally jeopardized.

09

Footnotes

1 All students have talent and ability. We use the term “high-ability” to refer to students with the intellectual capacity to reach high levels of academic performance in school. We use the term “low-income” to identify students’ family financial resources (as opposed to “low-socioeconomic status ” or “economically vulnerable”) because most of the data indicators included use some proxy of family income (free or reduced price lunch status, for example) to identify students. This by no means is intended to de-emphasize the importance of social capital in nurturing students’ academic potential.

2 Plucker, J., Hardesty, J. & Burroughs, N. (2013) Talent on the Sidelines: Excellence Gaps and America’s Persistent Talent Underclass.

3 Plucker et al. (2013)

4 Southern Education Foundation (January 2015) Research Bulletin A New Majority: Low Income Students Now a Majority in the Nation’s Public Schools. http://www.southerneducation.org/getattachment/4ac62e27-5260-47a5-9d02- 14896ec3a531/A-New-Majority-2015-Update-Low-Income-Students-Now.aspx

5 Members of the expert advisory board included Professor Carolyn Callahan (University of Virginia), Dr. Molly Chamberlin (Indiana Youth Institute), Peter Laing (Arizona Department of Education), Professor Matthew McBee (East Tennessee State University), Professor James Moore (Ohio State University), and Dr. Rena Subotnik (American Psychological Association). We gratefully appreciate their input, although all opinions expressed in this report are the responsibility of the authors.

6 The master list of indicators was lengthy and included readily identifiable performance data and institutional structures as well as a “wish list” of additional data that will be collected for use in future iterations of the state-by-state comparisons.

7 Data sources included a report called the 2012-13 State of the States in Gifted Education, from the National Association for Gifted Children (NAGC) and the Council of State Directors of Programs for the Gifted (CSDPG) (http:// www.nagc.org/resources-publications/gifted-state), various materials and reports provided by the College Board, materials posted online by the Organisation for Economic Co-operation and Development (OECD), International Association for the Evaluation of Educational Achievement (IEA), Education Commission of the States (ECS), and state education agency (SEA) websites and databases.

8 We acknowledge that our methodology probably depresses the input grades for states that attempt to address the needs of high-ability students specifically through the use of special schools. Although we intended to include such an indicator, we were not able to create a master list of special schools; this will be a priority in future versions of the report.

9 We adjusted the scoring cut points down for grade 8 reading to reflect the overall lower levels of student achievement in this subject/grade level in the nation.

10 https://education.ohio.gov/getattachment/Topics/Other-Resources/GiftedEducation/Reporting/School-District-Self-Report-on-Identification-and/2013- 2014-Planning-Document.pdf.aspx

11 http://b.3cdn.net/tomwolf/28dc8311d9bc153b07_uabm6br2y.pdf

12 We are sensitive to parent privacy concerns. Collecting data on individual students is inherently fraught with problems. However, data can be protected by being anonymized with student identification numbers, tracking progress can be done confidentially and results reported in the aggregate.

13 Some forms of acceleration may also require less differentiation on the part of teachers, as students are placed in a more appropriate challenge level given their ability in a specific subject.

14 Furthermore, although students from higher-income families may outperform students from lower-income families in the United States, both groups of students lag behind in international comparisons, even when controlling for family socioeconomic status (Plucker et al., 2013).

15 Regarding low-income students, see http://nces.ed.gov/programs/digest/d13/ tables/dt13_204.10.asp and DeNavas-Walt, C., & Proctor, B. D. (2014). Income and poverty in the United States: 2013 [U.S. Census Bureau, Current population reports, P60-249]. Washington, DC: U.S. Government Printing Office.; regarding performance of high-ability students, see Plucker et al. (2013).

10

About the Authors

Jonathan Plucker is the Raymond Neag Endowed Professor of Education at the University of Connecticut’s Neag School of Education. His research examines education policy and talent development, with over 200 publications to his credit. Recent books include Critical Issues and Practices in Gifted Education with Carolyn Callahan and Intelligence 101 with Amber Esping. His work defining and studying excellence gaps (http://cepa.uconn. edu/mindthegap) is part of a larger effort to reorient policymakers’ thinking about how best to promote success and high achievement for all children. He was the recipient of the 2012 Arnheim Award for Outstanding Achievement from the American Psychological Association and 2013 Distinguished Scholar Award from the National Association for Gifted Children. Professor Plucker is an APA and AAAS Fellow and has been ranked one of the top 100 most influential academics in education the past two years.

Jennifer Giancola is the Director of Research at the Jack Kent Cooke Foundation where she oversees the foundation’s internal and external research efforts. Her work focuses on issues of college readiness, access and success for students from all backgrounds. Prior to joining the foundation, Dr. Giancola led evaluations of nationwide federal and foundation-funded education programs as a senior associate at Abt Associates Inc., a social policy research firm headquartered in Boston, MA, where she evaluated postsecondary programs for the National Science Foundation, National Aeronautics Space Administration, and United Negro College Fund.

Grace Healey is an undergraduate student enrolled in the Neag School of Education at the University of Connecticut. She is currently pursuing a major in comprehensive special education, with the hopes of one day inspiring and promoting positive change in the world of special education in developing nations.

Daniel Arndt is a dual degree undergraduate student at the University of Connecticut, majoring in Biological Sciences and Secondary Biology Education. Previously, he interned for the Connecticut Invention Convention writing curricular resources and currently acts as a student teaching candidate at the Edwin O. Smith High School in Mansfield, Connecticut.

Chen Wang is a graduate student at the University of Connecticut, where she studies in the Neag School of Education’s Cognition, Instruction, and Learning Technologies program.

The Jack Kent Cooke Foundation is dedicated to advancing the education of exceptionally promising students who have financial need. By offering the largest scholarships in the country, indepth academic counseling and other direct services, the Foundation seeks to help high-performing, low-income students to develop their talents and excel educationally. In addition to providing students both counseling and financial support from middle school to graduate school, the Foundation provides grants for noteworthy and innovative initiatives that support high-performing, low-income students. Founded in 2000, the Foundation has awarded over $130 million in scholarships to nearly 1,900 students and over $80 million in grants. www.jkcf.org

11

Appendix A

INDICATOR DESCRIPTIONS AND DATA SOURCES

INPUTS

Each of the nine input indicators were weighted equally in the calculation of the Input grade for each state.

Input Indicator 1:

SEA annual report or monitoring/auditing of LEA G/T programs

Data source: 2012-13 State of the States in Gifted Education, from the National Association for Gifted Children (NAGC) and the Council of State Directors of Programs for the Gifted (CSDPG) (“State-of-the-States Report”) Table F, http://www. nagc.org/sites/default/files/Gifted-by-State/Table%20F%20 %28accountability%29.pdf

Rationale: A state that emphasizes advanced education should have some form of state-level monitoring for related LEA programs and interventions. States received full credit on this indicator if they reported either monitoring/auditing LEA gifted education services or preparing an annual report on the “state of the state” regarding advanced education. Specifically, the State of the States survey asks, “Does the state monitor/audit LEA’s GT Programs?” and “Does the state publish an annual report on state GT services?”

Input Indicator 2:

State accountability system

Data source: 2012-13 State of the States in Gifted Education, from the National Association for Gifted Children (NAGC) and the Council of State Directors of Programs for the Gifted (CSDPG) (“State-of-the-States Report”) Table F, http://www. nagc.org/sites/default/files/Gifted-by-State/Table%20F%20 %28accountability%29.pdf

Rationale: The inclusion of indicators in state K-12 accountability systems representing high levels of academic performance can be interpreted as a strong, formal statement of the importance of advanced education, especially when those indicators give schools and districts credit for helping low-income students achieve at high levels. States were given full credit on this indicator if their accountability systems included measures of growth for high achieving students and other indicators of excellence. These data were drawn from the State of the States survey (“Are there or will there be GT indicators on district report cards or other state accountability forms? If yes, what are the specific indicators included?”) and were supplemented by examinations of each state’s accountability system as described in applicable state statutes and SEA documents.

Input Indicator 3:

Participation in international assessments

Data source: 2012 PISA reports, http://www.oecd.org/pisa, 2011 TIMSS & PIRLS reports, http://timssandpirls.bc.edu/

Rationale: The ability to benchmark students’ achievement against those from other countries is becoming increasingly important in the rapidly globalizing world, and this is certainly true for the performance of advanced students. States were given full credit on this indicator if they participated as a region in at least one of the recent testing cycles of the major international assessments: TIMSS (2011), PIRLS (2011), or PISA (2012).

Input Indicator 4:

Requirements for identification and services

Data source: 2012-13 State of the States in Gifted Education, from the National Association for Gifted Children (NAGC) and the Council of State Directors of Programs for the Gifted (CSDPG) (“State-of-the-States Report”) Table C, http://www.nagc.org/sites/ default/files/Gifted-by-State/Table%20C%20%28mandates%20 %20funding%29.pdf

Rationale: Requiring LEAs to identify and serve advanced students is an indicator of the value a state places on academic excellence, including for low-income students who may be attending schools in which proficiency is valued more highly than advanced performance. Students received full credit on this indicator if they require services (i.e., with identification implied). Specifically, the State of the States survey asks, “Does the state have a mandate for GT ID or services? What areas are included in the mandate?”

Input Indicator 5:

State policies allowing early entrance to kindergarten

Data source: 2012-13 State of the States in Gifted Education, from the National Association for Gifted Children (NAGC) and the Council of State Directors of Programs for the Gifted (CSDPG) (“State-of-the-States Report”) Table D, http://www.nagc.org/ sites/default/files/Gifted-by-State/Table%20D%20%28state%20 policies%29.pdf

Rationale: Children should be able to enter kindergarten when they are intellectually ready to do so, not only when their birthday falls on the correct side of an arbitrary cut-off date. This may be especially important for low-income students, who may benefit from additional educational supports and social services that are available in K-12 schools. States were given full credit on this indicator if they have a state policy that allows early entrance to kindergarten. Specifically, the State of the States survey asks, “Does the state have a policy on early entrance to kindergarten?”

Input Indicator 6:

State acceleration policy

Data source: 2012-13 State of the States in Gifted Education, from the National Association for Gifted Children (NAGC) and the Council of State Directors of Programs for the Gifted (CSDPG) (“State-of-the-States Report”) Table D, http://www.nagc.org/ sites/default/files/Gifted-by-State/Table%20D%20%28state%20 policies%29.pdf

Rationale: Students should be able to move through the K-12 system at their own pace. For some students, this pace can be considerably accelerated, and the benefits of academic acceleration are well-documented. Having a state acceleration policy both sends a strong message that acceleration is valued and permissible and provides a policy lever for educators and parents to use when they encounter anti-acceleration bias. States were given full credit on this indicator if they have a state acceleration policy. Specifically, the State of the States survey asks, “Does the state have an acceleration policy?”

Input Indicator 7:

MS/HS concurrent enrollment and credit in HS

Data source: 2012-13 State of the States in Gifted Education, from the National Association for Gifted Children (NAGC) and the Council of State Directors of Programs for the Gifted (CSDPG) (“State-of-the-States Report”) Table D, http://www.nagc.org/ sites/default/files/Gifted-by-State/Table%20D%20%28state%20 policies%29.pdf

Rationale: Having access to high school courses while attending middle school provides talented students with challenging coursework that their school may not otherwise be able to offer. This may be especially important for low-income students, who are more likely to attend schools that suffer from highly limited resources, therefore limiting the number and range of advanced options in the middle school. At the same time, students who take high school coursework while in middle school should be able to get high school credit, which allows students to move through the K-12 system at a more appropriate pace and/or allows for greater enrichment opportunities when the students enter high school. States were given full credit on this indicator if they have policies that specifically allow middle school/high school dual enrollment, and if the state allows for such enrollment to result in the granting of high school credit. Specifically, the State of the States survey asks, “Are middle school students permitted to be dually/concurrently enrolled in high school?” and “May middle school students receive high school credit towards graduation for the courses in which they are dually/ concurrently enrolled?”

Input Indicator 8:

State high school honors diploma designation

Data source: ECS graduation policy database http://ecs.force.com/ mbdata/mbprofall?Rep=HS02

Rationale: Having a state-level honors designation sends a strong message that the state prioritizes advanced achievement in its schools. States were given credit on this indicator if they have an official state honors diploma or a similar type of designation for high achieving students as they graduate from high school.

Input Indicator 9:

Gifted coursework required in teacher and administrator training

Data source: 2012-13 State of the States in Gifted Education, from the National Association for Gifted Children (NAGC) and the Council of State Directors of Programs for the Gifted (CSDPG) (“State-of-the-States Report”) Table E, http://www.nagc.org/sites/ default/files/Gifted-by-State/Table%20E%20%28training%29.pdf

Rationale: If educators are not exposed to material on the education of high ability students, it is unlikely that those educators will be sensitive to the needs of those students, especially those who are low-income. States were given full credit on this indicator if they require coursework on gifted and talented learners in pre-service training and administrator training, partial credit if such coverage is required in only one of the two areas. Specifically, the State of the States survey asks, “Does the state require GT coursework for all pre-service teachers?” and “ Is training in nature & needs of GT students required in administrators’ coursework?”

Unavailable Input Indicators

A number of input variables were not included because of lack of availability and/or data reliability issues. We hope to collect these data in subsequent years.

For example, we intended to include an analysis of press releases from each state from the annual release of state test results (e.g., Does the press release even mention the percentage of students who score at advanced levels?), but those press releases proved to be very difficult to obtain for all 50 states. We could not determine which states allow early high school graduates to received state financial aid for college, in part because of the difficulty in determining which states allow early high school graduation. And we could not determine which states have adopted official definitions of high performance, giftedness, talent, educational excellence, or related terms.

PARTICIPATION

Participation data provide insight into the vital link between inputs and outcomes in the education of advanced students. However, we did not find any of the desired participation variables to be of sufficient quality to be included in this report. For example, the expert panel recommended that the number of Governor’s schools or other publicly-funded special schools for advanced students be considered as an indicator of a state’s emphasis on meeting the academic needs of those students. But no standard list of those schools exists, and although we pulled the data from various sources, we were not confident in the validity of the final list. We were not able to find a data base with the percent of students who take algebra by 8th grade that was less than 10 years old, and searching individual SEA data sets was not fruitful. The percent of low-income students taking Advanced Placement courses was also not available. Finally, data on funding for advanced education was considered to be too unreliable and too much of a black box to be included in the final model (i.e., it was impossible to determine which activities were funded by the reported resources). These and other measures of student participation in advanced learning will be part of subsequent year’s data collections.

OUTCOMES

Each of the nine outcome indicators were equally weighted in the calculation of the Outcome grade for each state.

Outcome Indicators 1-5:

Advanced achievement, all students

Data sources: National Assessment of Educational Progress (NAEP), http://nces.ed.gov/nationsreportcard/, College Board, http://media. collegeboard.com/digitalServices/pdf/ap/rtn/10th-annual/10thannual-ap-report-to-the-nation-single-page.pdf

Rationale: A key outcome is obviously the percent of public school students who perform academically at advanced levels. We included indicators on student performance at several levels: NAEP math and reading/language arts data for Grade 4 and Grade 8, and Advanced Placement exam data to represent high school achievement. To receive full credit on these indicators, state data needed to reflect:

  • At least 10% scored in the advanced range (Grade 4 and 8 math, Grade 4 reading)
  • At least 8% scored in the advanced range (Grade 8 reading)
  • At least 21% of students scored 3 or higher on at least one AP exam

The five achievement indicators were equally weighted, and they collectively accounted for half of the Outcome grade.

Outcome Indicators 6-9:

Excellence gaps

Data source: National Assessment of Educational Progress (NAEP), http://nces.ed.gov/nationsreportcard/

Rationale: High levels of academic progress do not necessarily mean that all student subgroups share the same levels of accomplishment. If a state has a relatively large percent of students scoring advanced on NAEP, but most of those students are not low-income, the state’s success in promoting educational excellence can be called into question. To receive full credit on this indicator, a state’s NAEP data showed that the percent of low-income students scoring advanced was no less than 41% of the percent of other students scoring advanced. For the purposes of this indicator, low-income was defined as qualifying for free/reduced price lunch. The excellence gap indicators were limited to Grades 4 and 8 reading and math because (a) there is little evidence that such gaps shrink as students work through the K-12 system and (b) free/reduced price lunch data is generally considered to be less reliable with older students.

Unavailable Outcome Indicators

Compared to the Input and Participation indicators, most of the desired outcomes were available and are included in this report. One exception is the percent of students in each state’s graduating cohort that earned a 4 or higher on at least one AP exam. These data are not readily available, even from the College Board. We also wanted to report the number of students who take advantage of early graduation from high school, but those data are reported inconsistently across states, with no central data collection on that variable. We did not include the number of students taking Algebra by 8th grade because few states report this information. Finally, we omitted trends in excellence gaps, because states’ excellence gaps appear to generally be quite stable. Since they are also rather large, states had little opportunity to benefit from the indicator, so it was not included in the final model.

12

Appendix B

State Data Tables

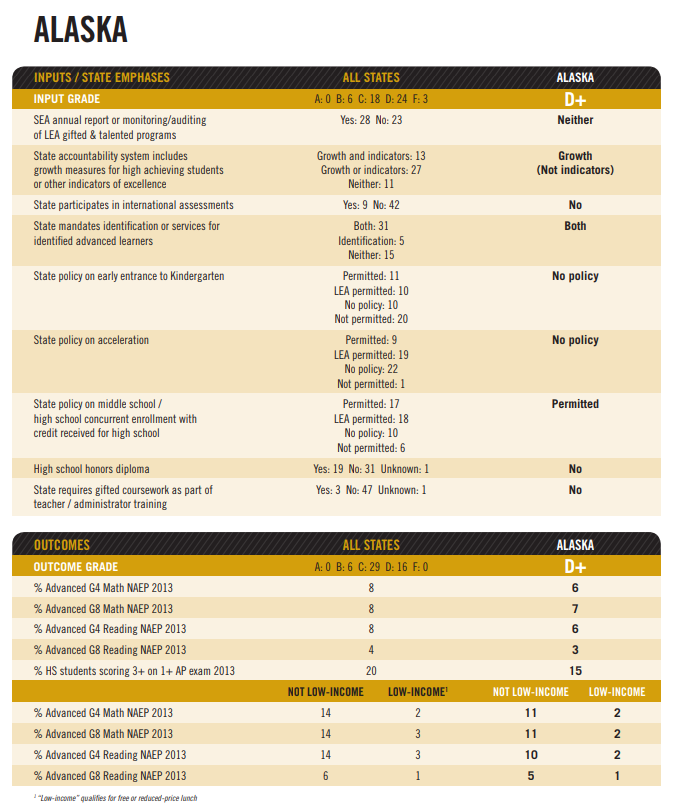
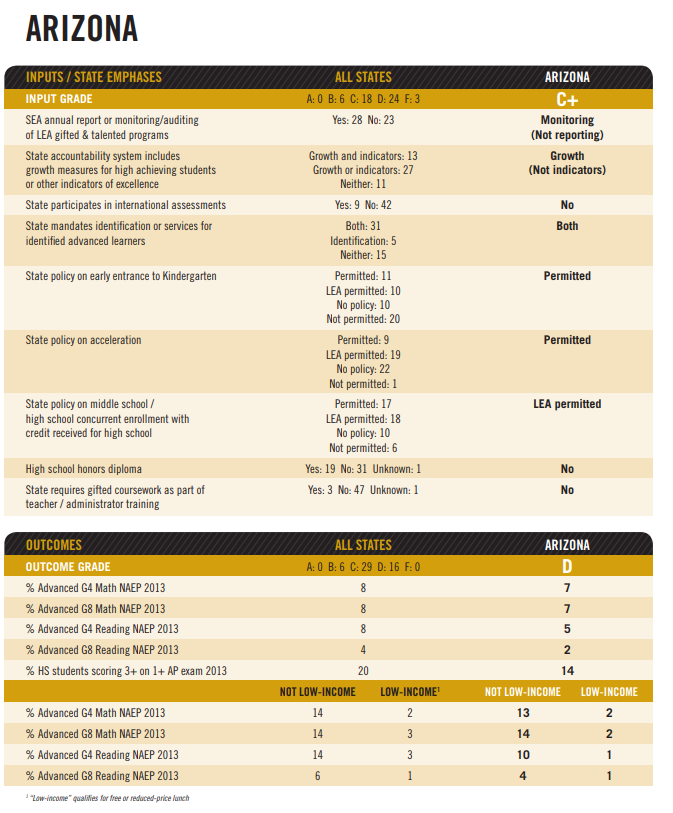
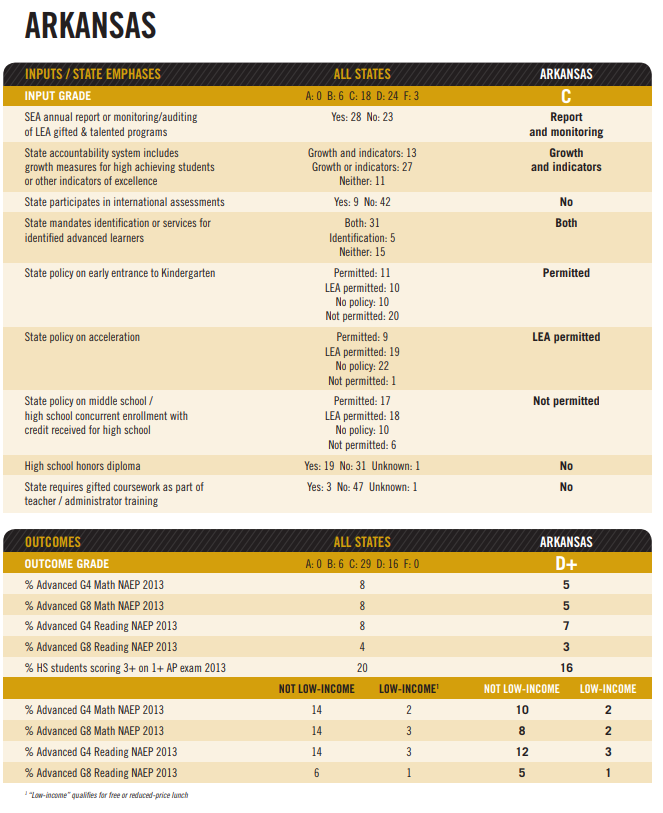
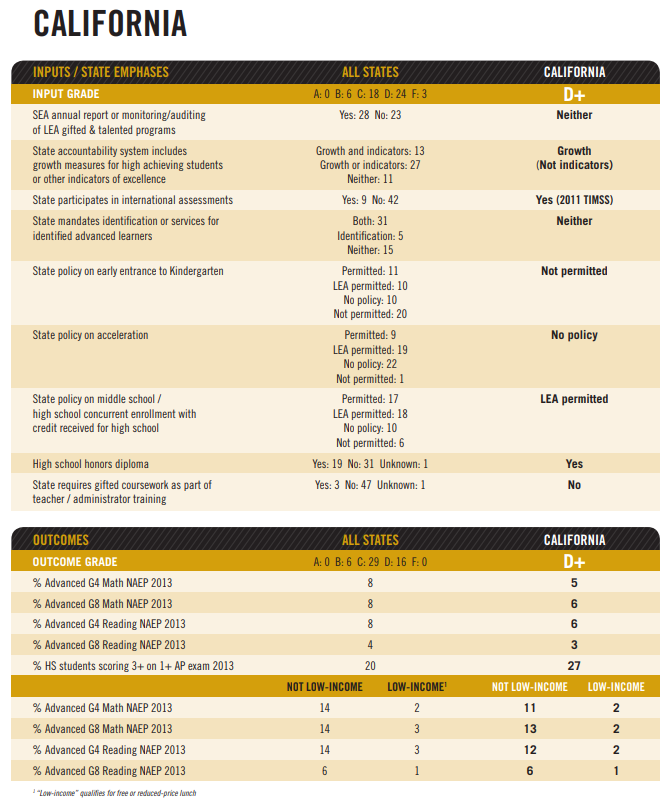
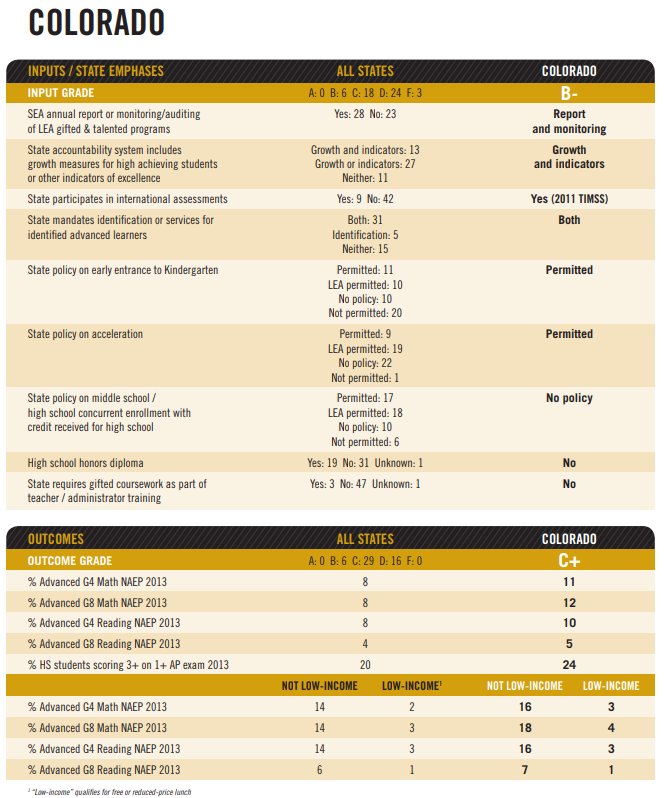
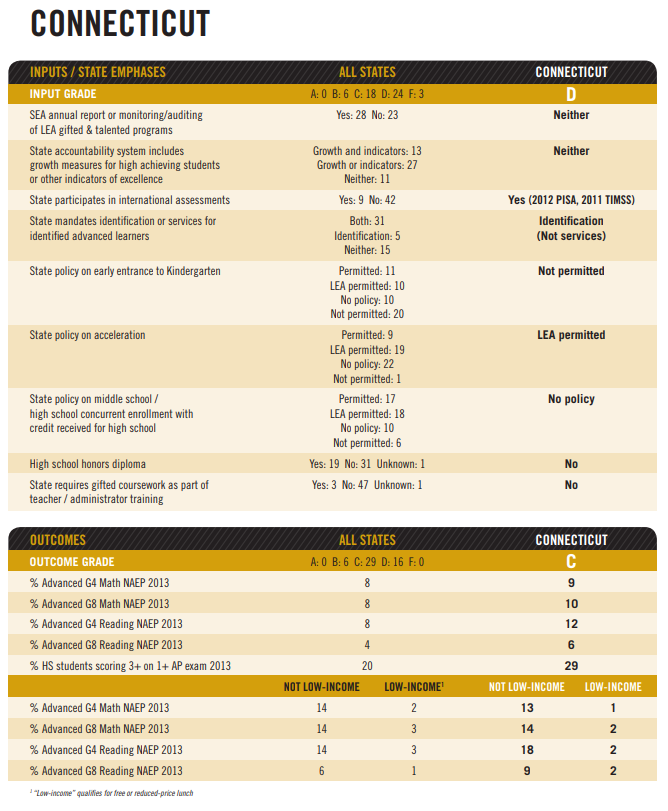
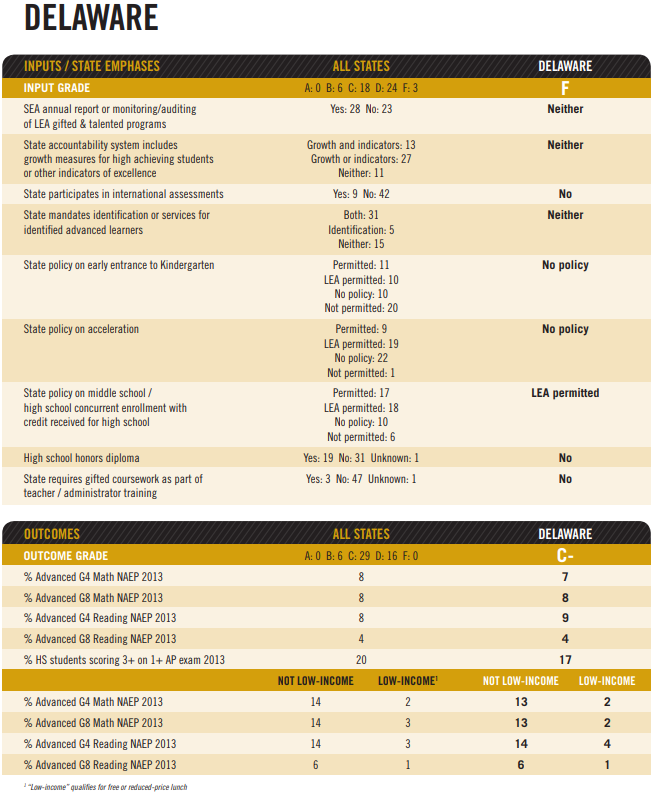
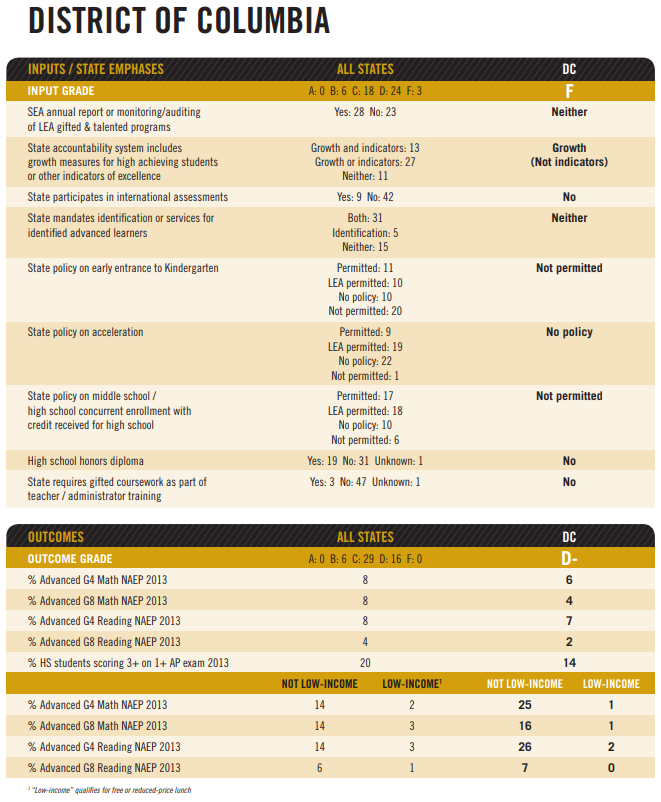
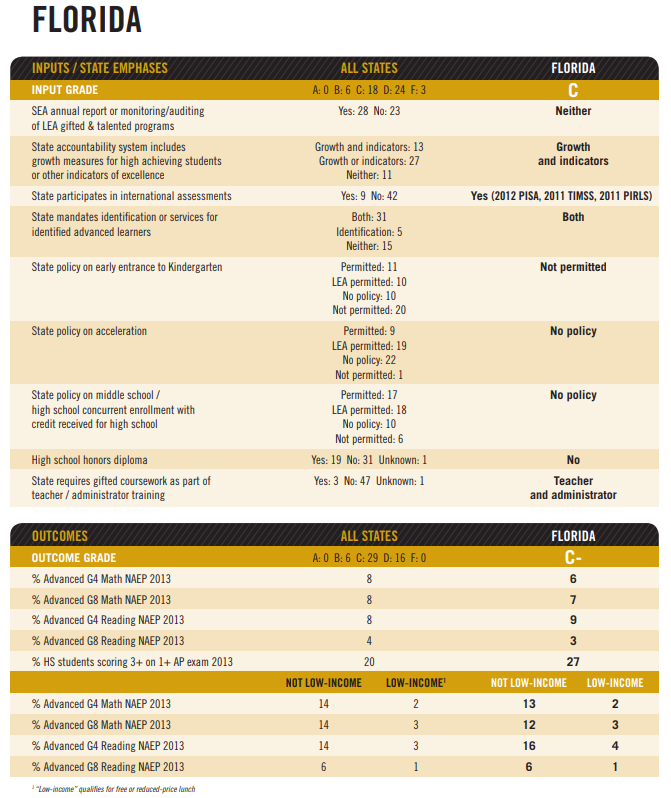
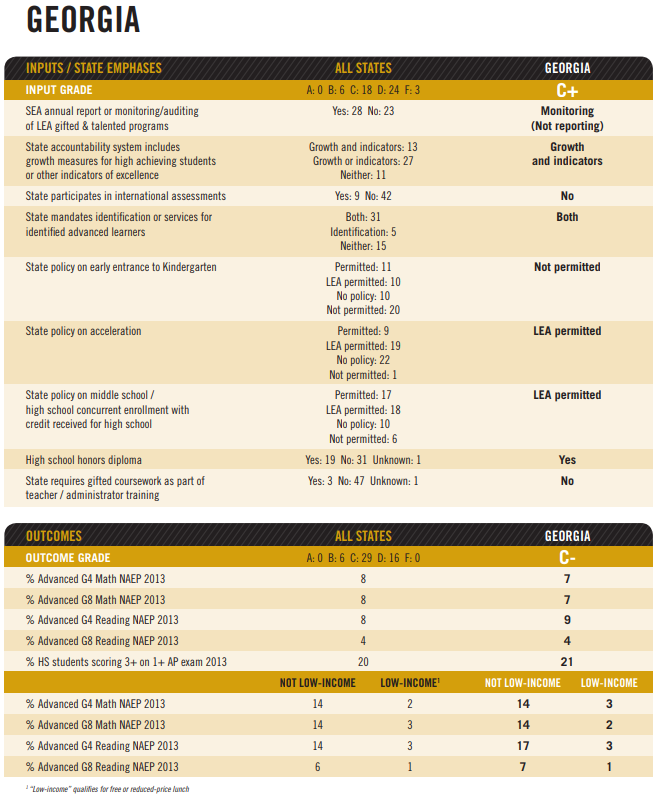
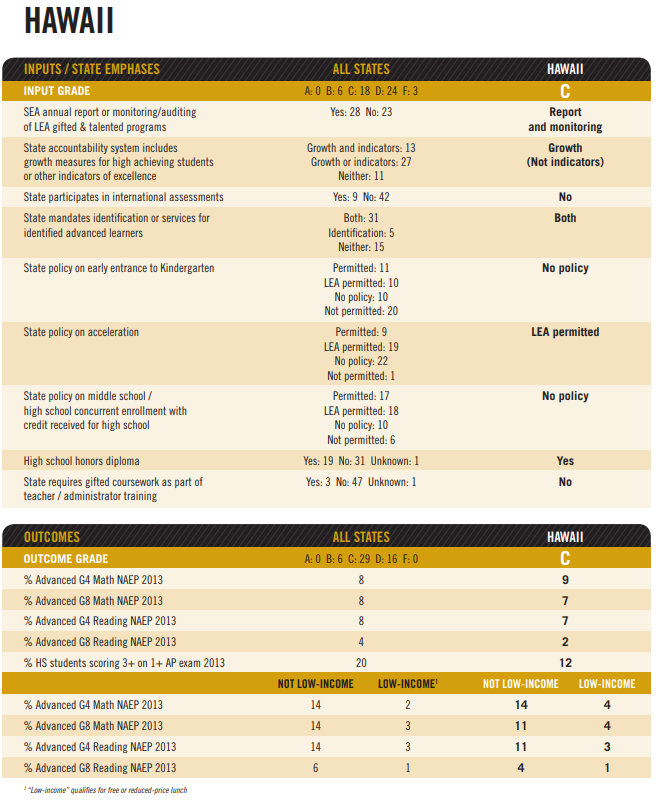
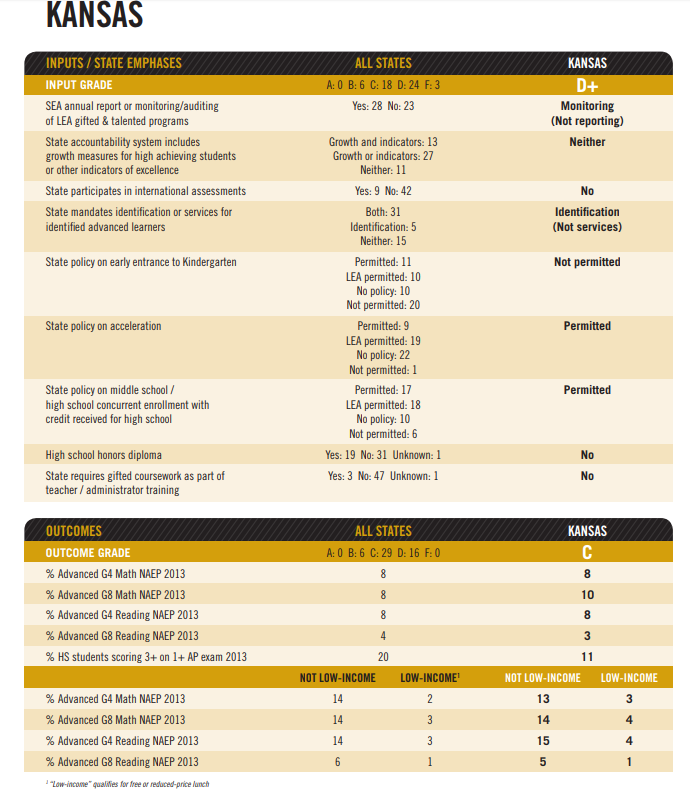
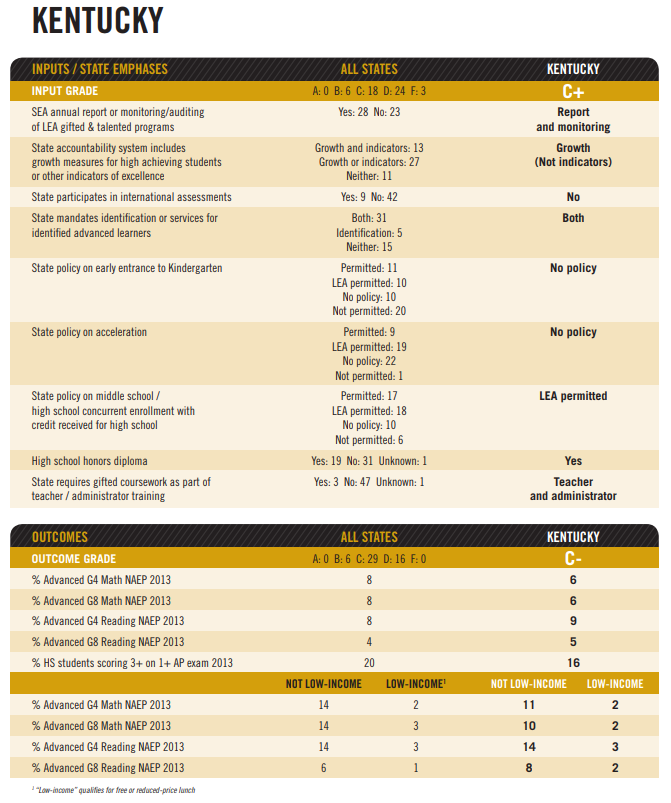
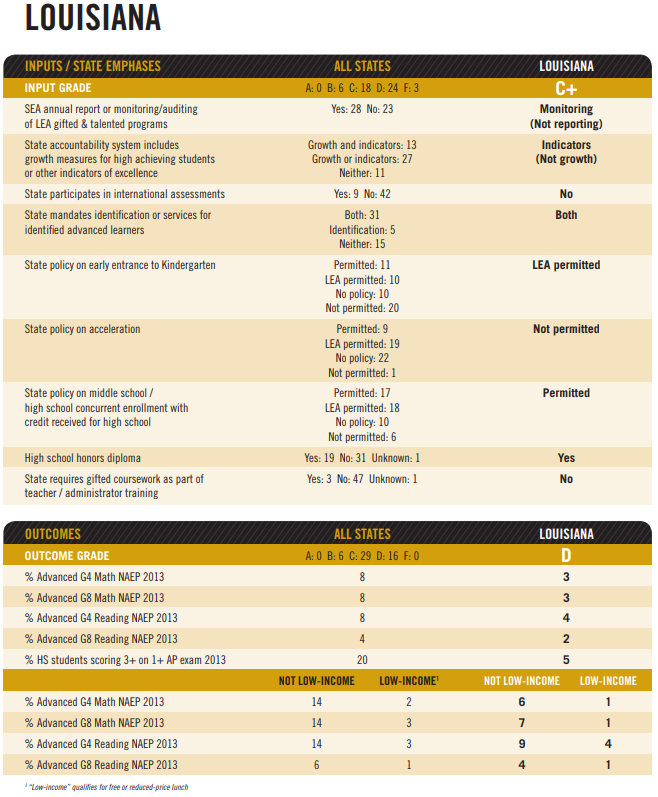
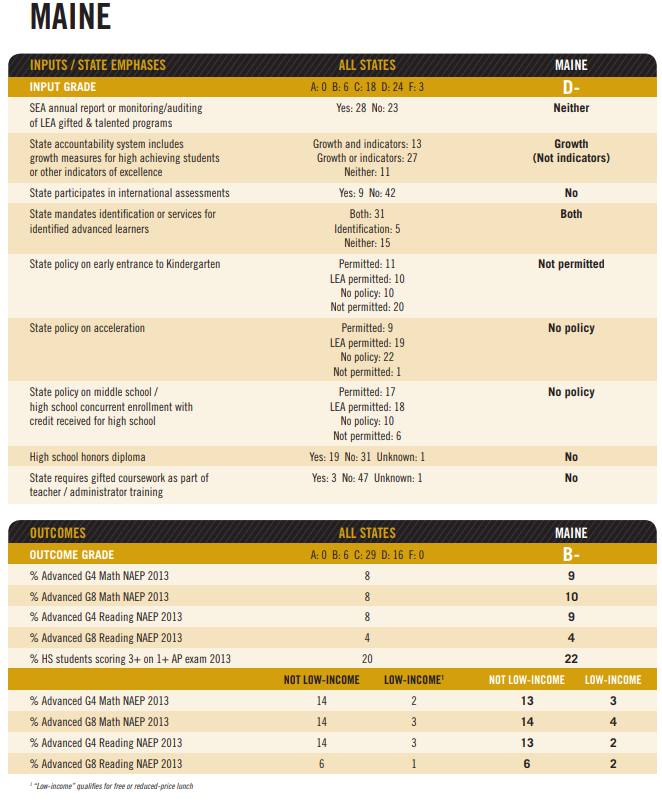
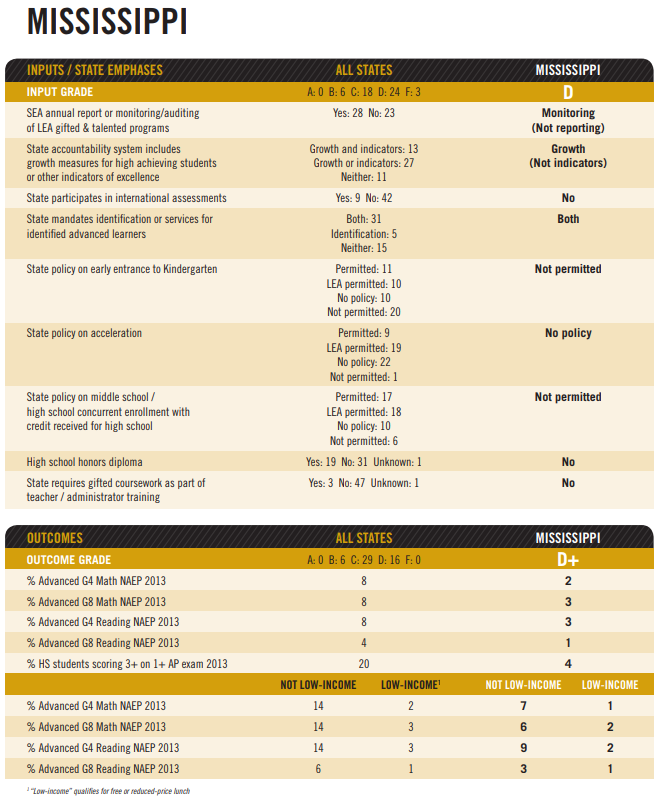
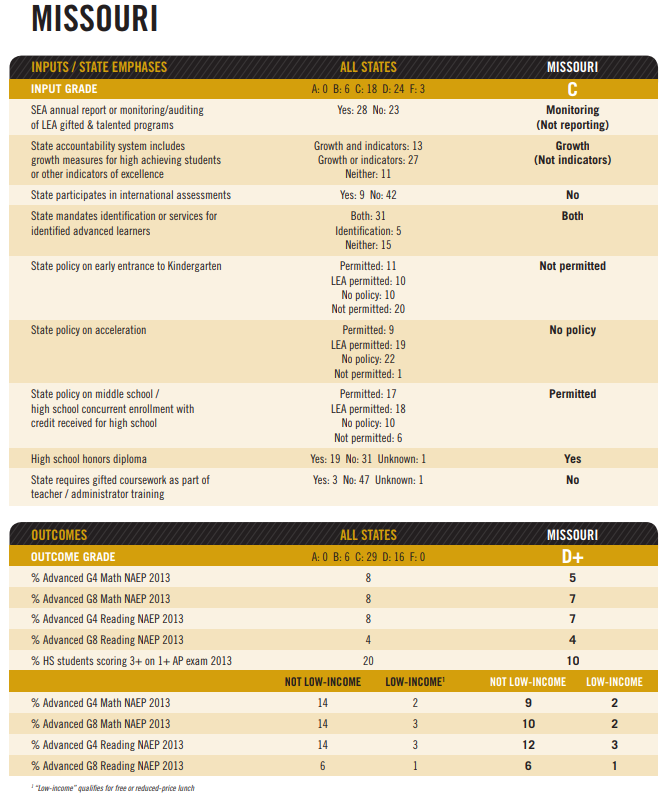
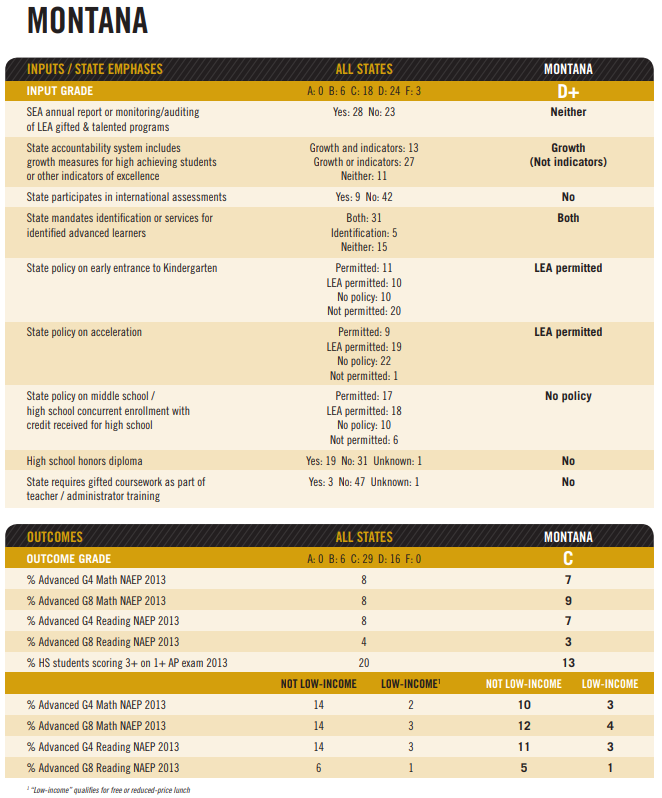
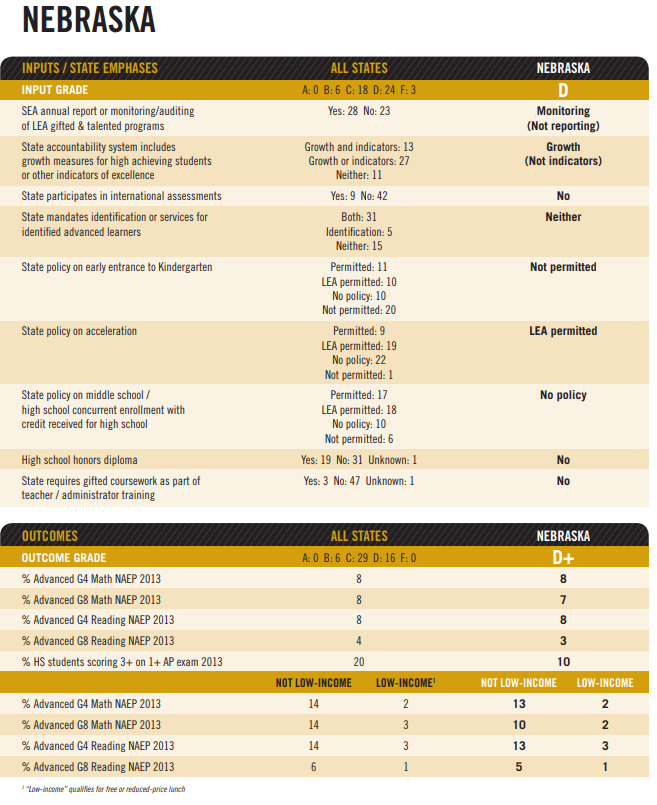
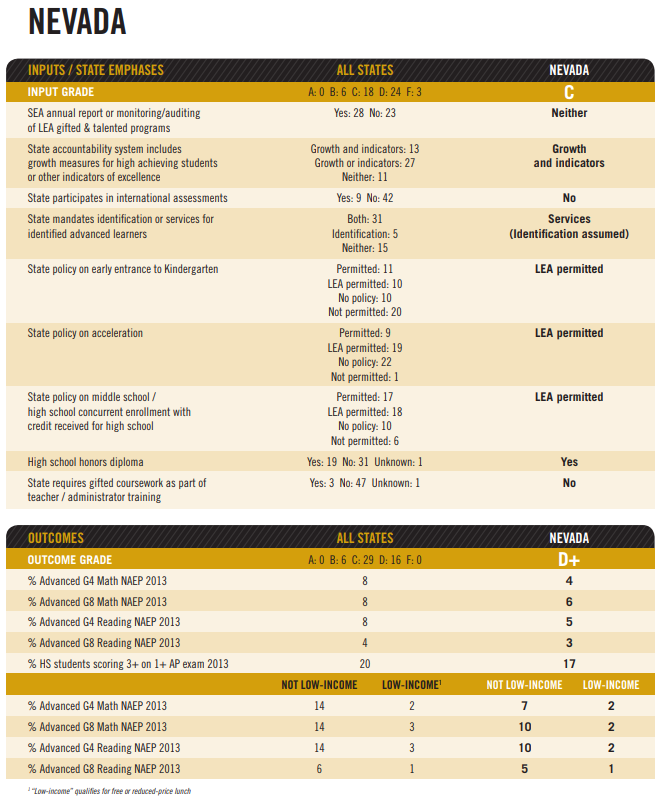
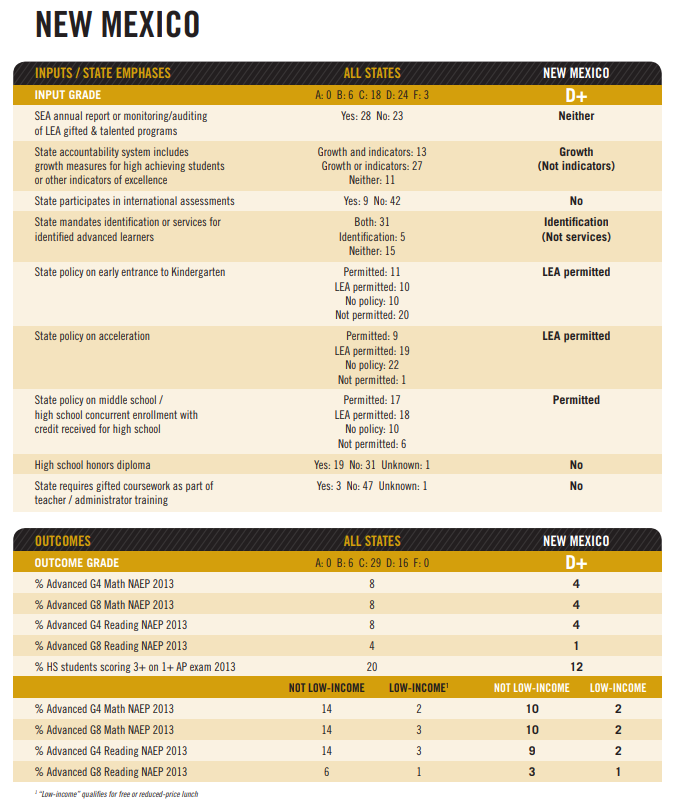
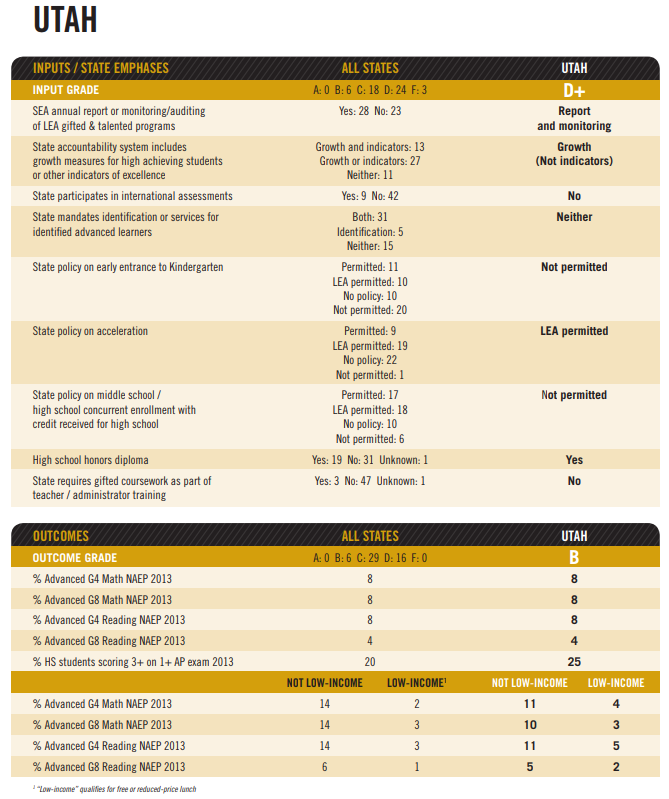
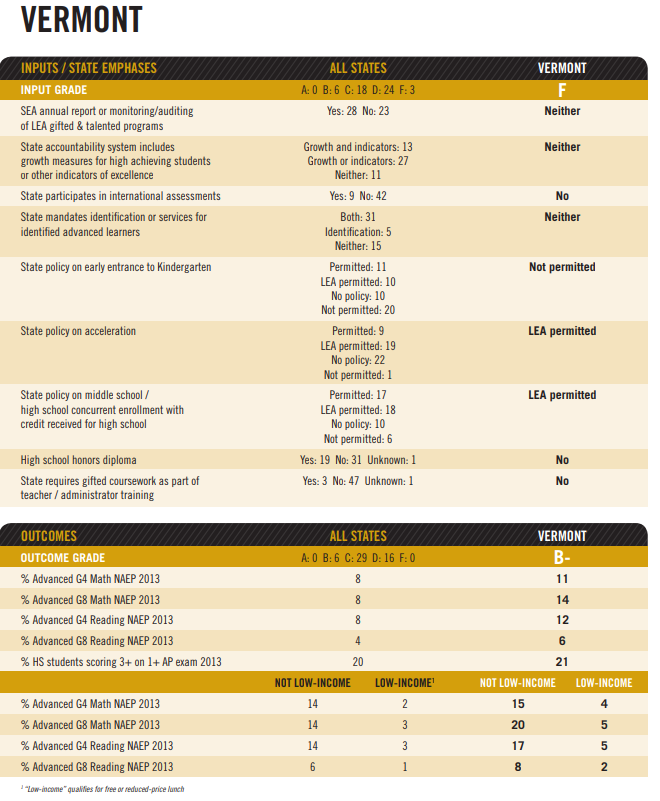
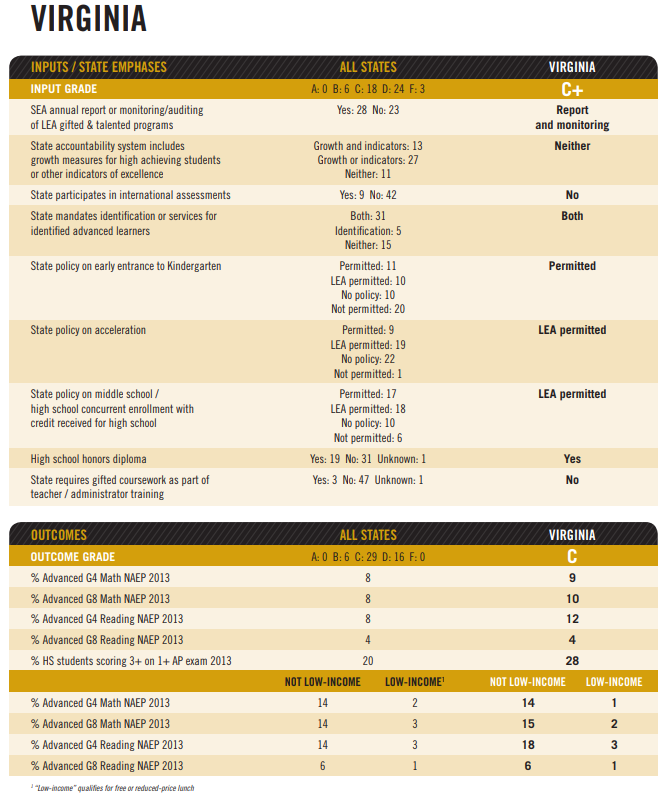
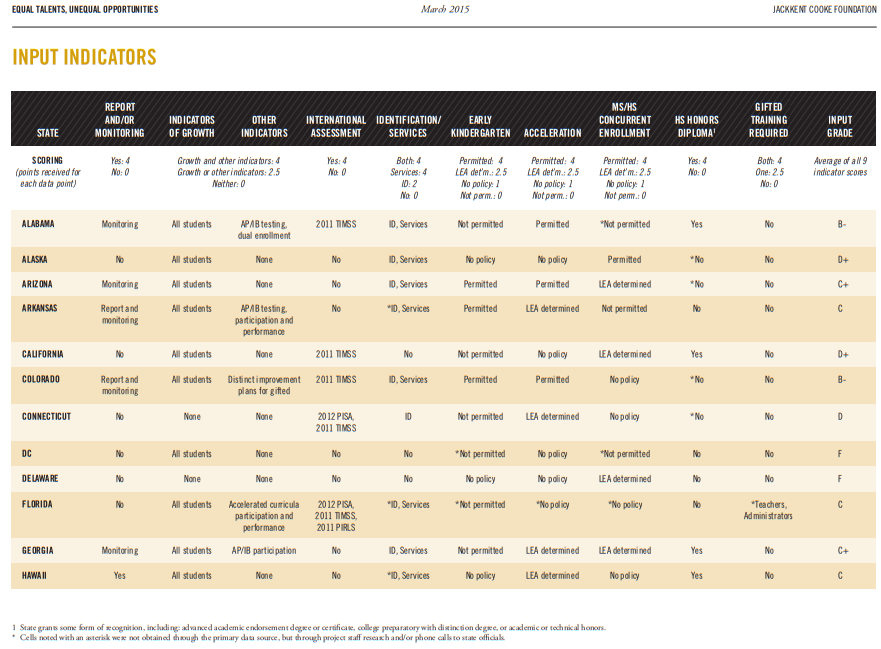
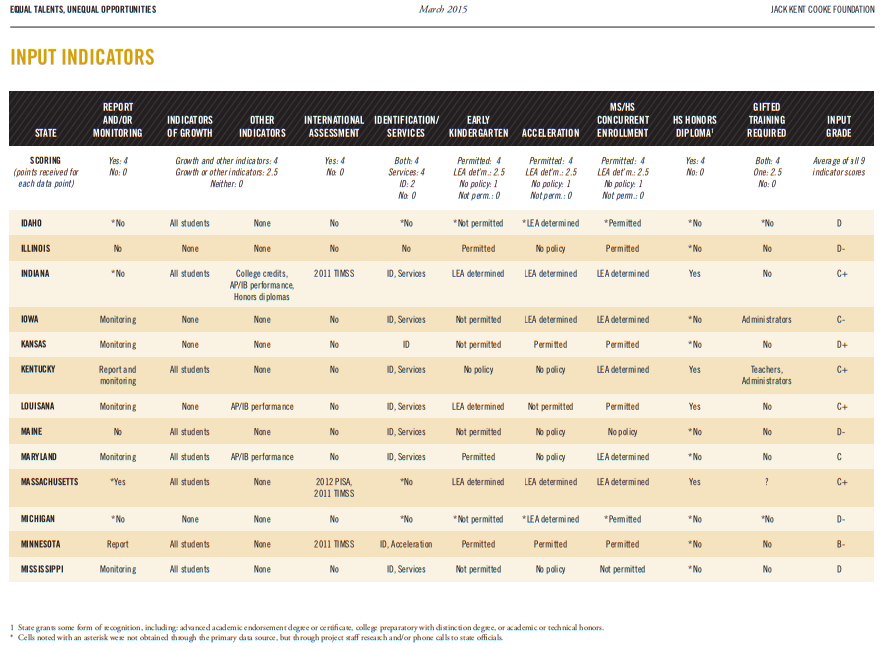
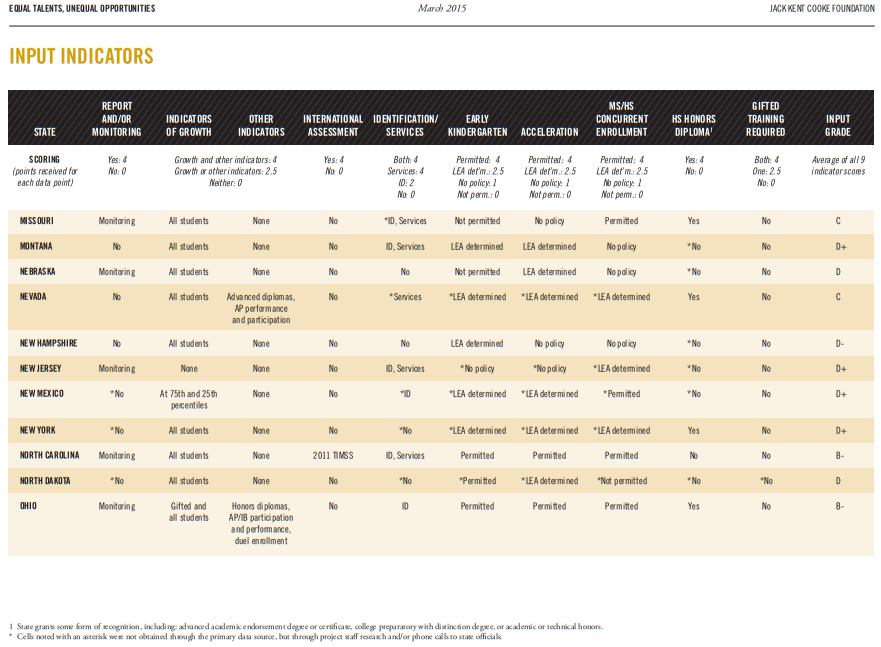
The following tables report the specific indicators for each state, Inputs and Outcomes. Cells noted with an asterisk were not obtained through the primary data source, but through project staff research and/or phone calls to state officials.
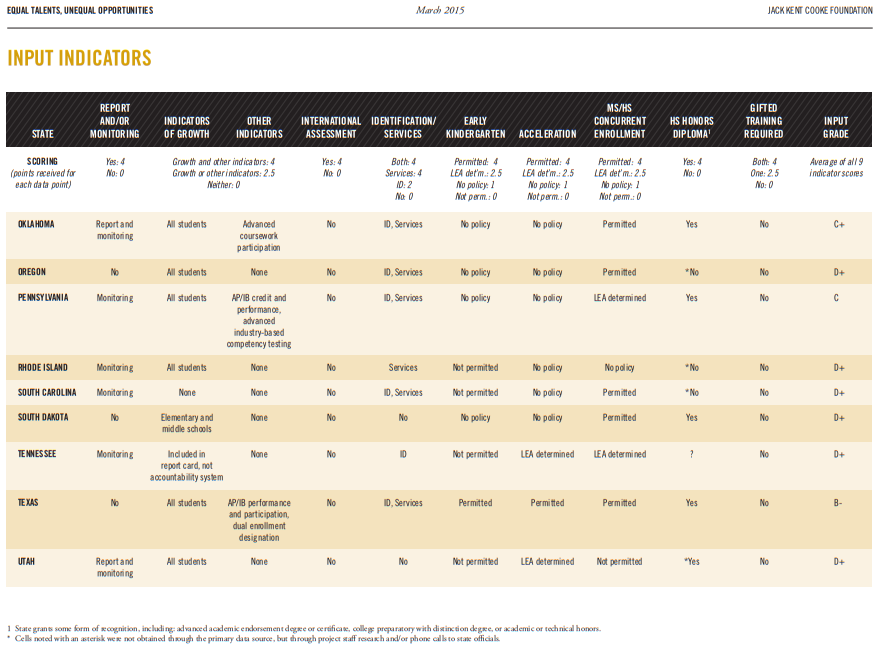
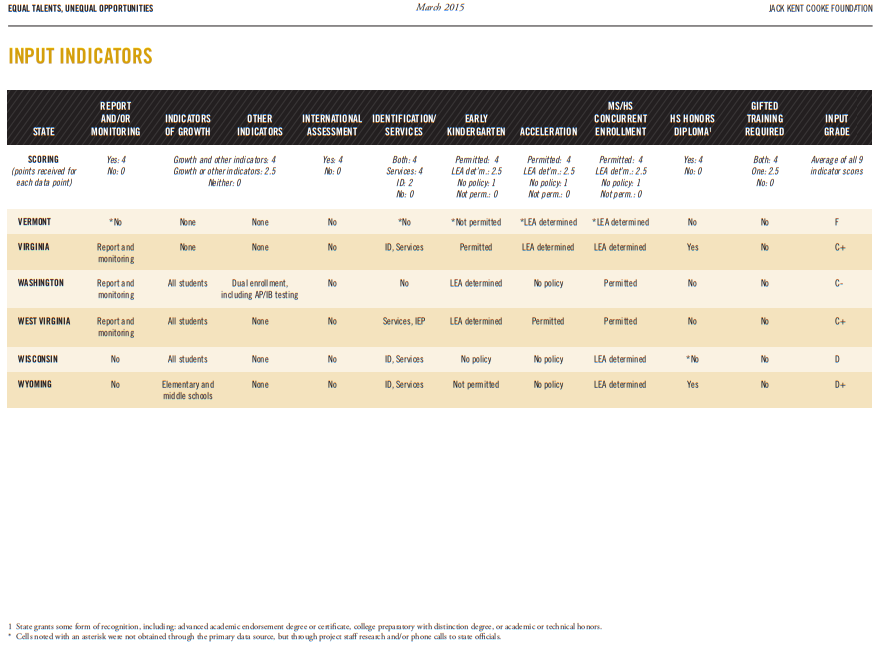
13

State Report Cards