
State University No More: Out-of-State Enrollment and the Growing Exclusion of High-Achieving, Low-Income Students at Public Flagship Universities
State University No More
Public flagship state universities have long been the dominant “engines of social mobility” for high-achieving, low-income students.1 These institutions were founded to provide what University of Michigan President James Angell referred to in the late 1800s as “an uncommon education for the common man” who could not afford tuition at elite private institutions.2
Public flagship universities have more potential to help talented, low-income students realize their full potential than any other type of postsecondary institution. Yet, contemporary debates about access inequality often focus on selective private institutions.3,4 This despite the fact that these boutique colleges enroll a tiny share of the total number of undergraduates in the United States and cannot deliver social mobility en masse. State policymakers increasingly view community college transfer as the preferred pathway to the baccalaureate for low-income students. However, starting at a community college dramatically decreases the probability of receiving a bachelor’s degree.5 Public regional universities are important engines of baccalaureate attainment. State higher education systems designate public flagship universities with the responsibility of educating the future business, professional, and civic leaders of the state.6,7 Therefore, as a matter of policy, we should be channeling talented, low-income students to the state public flagship universities.
Unfortunately, policy reports by The Education Trust and the New America Foundation argue that many public flagship state universities are abandoning their historical commitment to access for talented moderate- and low-income students.8,9,10 At the University of Michigan, for example, average family income in 2014 was $200,000, which president emeritus James Duderstadt characterized as, “more characteristic of society’s ‘1%’ than ‘the common man.’”11
Many public flagship universities today are prioritizing affluent out-of-state students, who are charged higher tuition, over the moderate- and low-income state residents who they were created to serve. For prestigious public flagship universities (e.g., the University of Michigan and UCLA) that attract affluent, high-achieving out-of-state students, out-of-state enrollment growth simultaneously promotes the pursuits of revenue generation and academic prestige.12 However, growth in the share of out-of-state students is associated with a decline in the share of able, moderate- and low-income students and increases the sense of isolation for such students at prestigious flagship campuses.13 Furthermore, out-of-state enrollment growth also crowds-out in-state enrollment at prestigious public flagships.14
By contrast, less prestigious public flagship universities (e.g., University of Arizona and the University of Arkansas) attract out-of-state applicants with lower records of academic achievement, often targeting those who have been denied entry to public flagship universities in their home states.15,16 These students are valued because they can afford much higher out-of-state tuition revenue, but many fall short on aptitude and effort and view college life as a continuing party.17 In great numbers, these students change the social and academic climate of a flagship state university, making high-achieving, low-income students feel unwelcome for their academic effort and socially excluded for their lack of money.
Sadly, in many states the once glorious
flagship university is now the repository
of a majority out-of-state students,
many of whom are dramatically less
academically oriented.
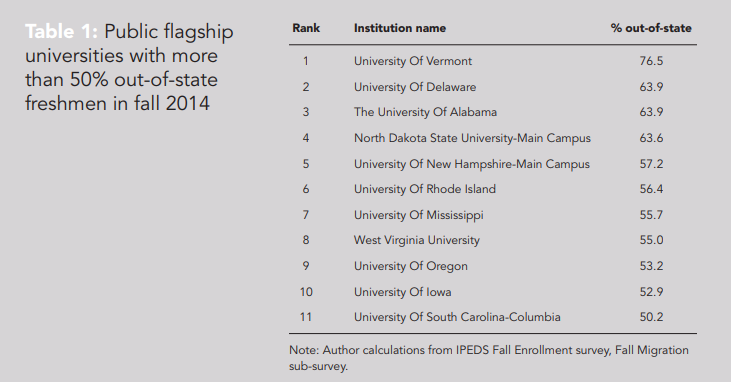
There was a time when aspiring high-achieving, low-income students were sought after by admissions officers of state flagship universities because their inclusion fulfilled the mission of the institution, i.e., to provide a route enabling the industrious student to receive a superior education and become a successful professional. Those days are ending. Sadly, in many states the once glorious flagship university is now the repository of a majority out-of-state students, many of whom are dramatically less academically oriented (Table 1).
This brief argues that social mobility is a declining priority for flagship universities in an increasing number of states. High-achieving, low-income students are tragically no longer able to look on their state’s public flagship universities as engines to permit them to climb the ladder of socioeconomic class. Many flagships have become crass, moneymaking operations.
The first section of this brief shows that even a dramatic increase in access at selective private colleges would affect a relatively small number of moderate- and low-income students. Therefore, policy debates about access should relinquish the focus on selective privates and focus more on public flagship state universities, which have the capacity to serve large numbers of such students. The second section shows that in many states higher education funding has declined while tuition price has increased, undermining access to public flagship universities for moderate- and lowincome students. Section three shows that public universities have responded to cuts in state funding by increasing their out-of-state enrollment. Unfortunately, out-of-state students are often less qualified and lacking in serious academic interests, particularly at less prestigious flagship universities. The fourth section reviews ethnographic research by Elizabeth Armstrong and Laura Hamilton, which describe how the shift towards accepting more out-of-state students adversely affects the academic and social climate.18
The brief concludes with policy recommendations to reclaim the historic mission of social mobility through education.
SELECTIVE PRIVATE COLLEGES ARE BOUTIQUES, NOT SIGNIFICANT ENGINES OF SOCIAL MOBILITY
National debates about access for high-achieving, low-income students devote a disproportionate share of attention to selective private colleges and universities. For example, Stanford University Professor Caroline Hoxby’s influential work on “under-matching” by high-achieving, low-income students defines “selective colleges” using metrics (e.g., SAT/ACT scores and Barron’s Profiles of American Colleges) that focus primarily on private institutions.19,20 In turn, Hoxby’s focus on selective college selection strongly influenced policy discourse about access inequality by the Obama administration.21,22
In the mass media, articles addressing access for low-income students at elite private colleges dominate the headlines. In the mass media, articles addressing access for low-income students at elite private colleges dominate the headlines.
About 2.6 million undergraduates attended the public flagship state
universities in 2014-15, representing 10.9% of all undergraduates. In other
words, four times as many students attend public flagship universities as
attend selective private institutions.
For example, Malcolm Gladwell’s podcast on college access for students of modest means contrasts efforts made by Vassar College to increase enrollment of low-income students with Bowdoin College, which spends money on “country club” amenities to attract and retain wealthy students.23
The New York Times’ “College Access Index” provides a less extreme example of media focus on selective private colleges. This index ranks the “top colleges doing the most” to graduate low-income students. The 2015 iteration ranked 179 institutions. The top seven institutions were all public flagship universities. However, 18 of the top 30 institutions were privates. For example, Vassar, Amherst, and Pomona were ranked 8th, 9th, and 10th, respectively.24 Yet the absolute number of moderate- and low-income students enrolled in these institutions is tiny. In 2014-15, Vassar College had 613 recipients of Pell Grant – the federal government’s grant program for low-income students – who represented 23.2% of all undergraduates. Amherst College had 442 Pell recipients, who represented 23.1% of all undergraduates.25
Pomona College had 326 Pell recipients, who represented 19.6% of all undergraduates. The absolute number of Pell Grant recipients that these elite private colleges enroll is a mere rounding error in comparison to Pell Grant enrollment at public flagship universities. For example, the University of Washington ranked 13th on the Access Index and enrolled 11,807 Pell Grant recipients (26% of undergraduate enrollment) in 2014-15, while the University of New Mexico enrolled 13,134 Pell Grant recipients (38% of its undergraduate enrollment), but was not ranked by the Access Index because its five-year graduation rate was below 75%.
The attention showered on selective private colleges is unhelpful. On one hand, it is true that these institutions control access to elite social and employer networks.26About 2.6 million undergraduates attended the public flagship state universities in 2014-15, representing 10.9% of all undergraduates. In other words, four times as many students attend public flagship universities as attend selective private institutions. Therefore, ensuring that affluent households and legacy students do not monopolize access to selective private colleges is a worthy goal. On the other hand, selective private colleges and universities are tiny compared to state public flagship universities. If we are concerned with helping as many high-achieving, moderate- and low-income students as possible to realize their full potential and achieve social mobility, we cannot let small selective private colleges dominate debates about access.
A few descriptive statistics further demonstrates that selective private institutions are boutiques while public flagships can be massive engines of social mobility.27
Figure 1 shows the distribution of undergraduates by institutional type. In 2014-15, about 626,000 undergraduates attended all of the private selective colleges, representing about 2.7% of the 23.6 million undergraduates in the U.S. By contrast, about 2.6 million undergraduates attended the public flagship state universities in 2014-15, representing 10.9% of all undergraduates. In other words, four times as many students attend public flagship universities as attend selective private institutions.
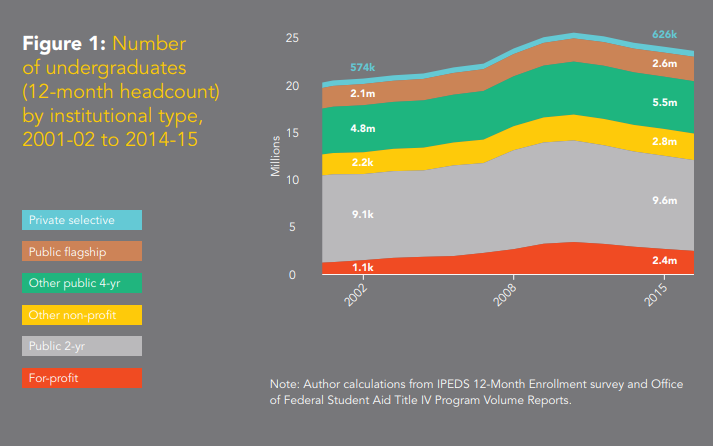
Figure 2 shows the number of Pell Grant recipients by institution type in 2014-15. Of the 8.2 million undergraduates receiving a Pell Grant, only 100,000 attended a private selective college, representing 1.2% of the total Pell population.
Public flagship universities enrolled
about 710,000 Pell Grant recipients,
representing about 8.7% of the total
Pell population, or seven times the
number at private selective colleges.
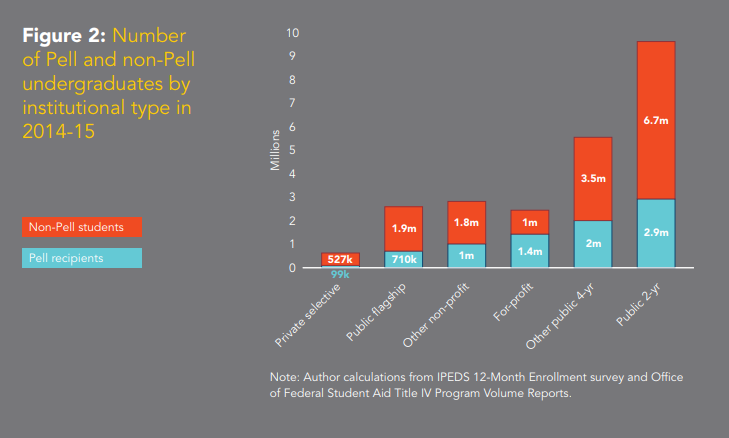
By contrast, public flagship universities enrolled about 710,000 Pell Grant recipients, representing about 8.7% of the total Pell population, or seven times the number at private selective colleges. While total enrollment and total Pell Grant enrollment at selective privates is a drop in the bucket, public flagship universities enroll a substantial share of all undergraduates and a substantial share of all Pell Grant recipients.28
In view of the limited number of spaces at selective private colleges, the real question is whether high-achieving, moderate- and low-income students have access to public flagship universities on an equal footing. Recent policy changes make clear that public flagship universities are abandoning their historical commitment to social mobility, and focusing instead on revenue generation by prioritizing enrollment by out-of-state students.29,30
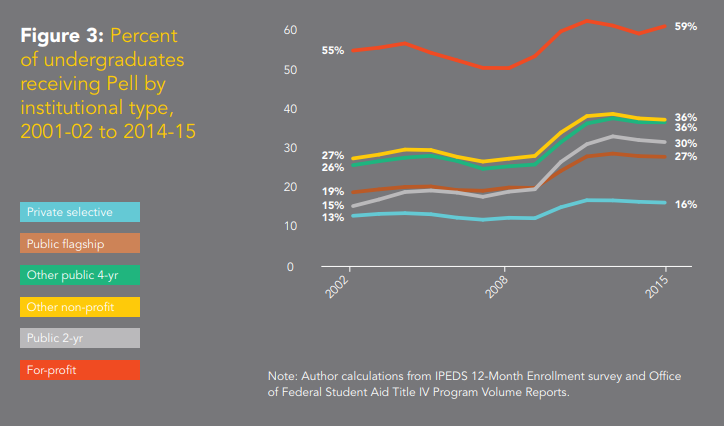
Figure 3 shows that the percentage of Pell Grant recipients at public flagships hovered around 20% throughout most of the early 2000s. From 2009 to 2012, the percentage of Pell Grant recipients increased substantially, but this growth was due primarily to the Obama administration increasing Pell Grant funding, rather than to efforts by universities. Since 2011-12, the percentage of Pell Grant recipients at public flagship universities has actually declined slightly and remains much lower than the percentage of Pell Grant recipients at other public universities. As a result, there are fewer moderate- and low-income students attending public flagship state universities and their opportunity for moving up the socioeconomic ladder has been reduced. We turn next to state funding policy that has stimulated this unfortunate trend.
Enrollment by moderate- and
low-income students at public
flagship state universities has
stagnated because states have
disinvested in public higher
education.
STATE DISINVESTMENT AND RISING TUITION PRICE
Enrollment by moderate- and low-income students at public flagship state universities has stagnated because states have disinvested in public higher education. Figure 4 shows change over time in the average of total state higher education funding divided by the number of 18-24-year-olds in the state.
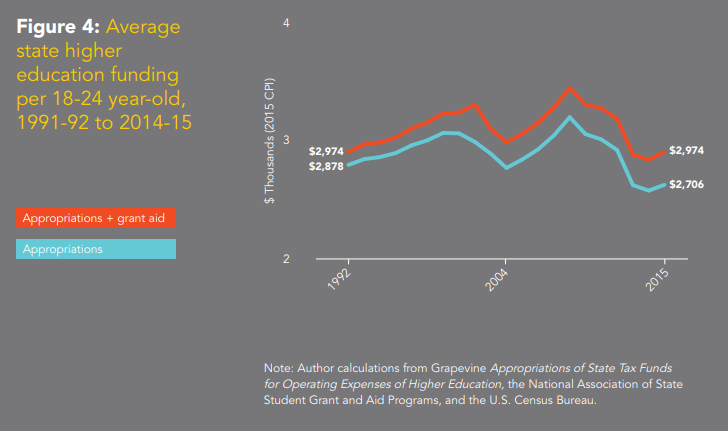
Throughout the 1990s and the early 2000s, state funding per capita generally fell during recessions and rose during economic recoveries. Starting in 2009, however, state funding per capita has declined dramatically and has not come close to pre-recession levels, even as the economy recovered. Table 2 shows that state funding per 18-24 year-old differs wildly across states. For example, in 2014-15 North Carolina spent $4,081 per 18-24-year-old while while Pennsylvania spent only $1,720 and Arizona spent even less at $1,397. New Hampshire, the worst state on this measure, spent only $959 per 18-24-year-old.
State funding cuts cause tuition price to increase.31,32
Though state policymakers retain authority to approve changes in in-state tuition in most states, they usually allow universities to increase tuition price to compensate for state funding cuts.33
Figure 5 shows that the average (inflation-adjusted) price of in-state tuition and mandatory fees at public flagship universities has more than doubled since 1999-2000.
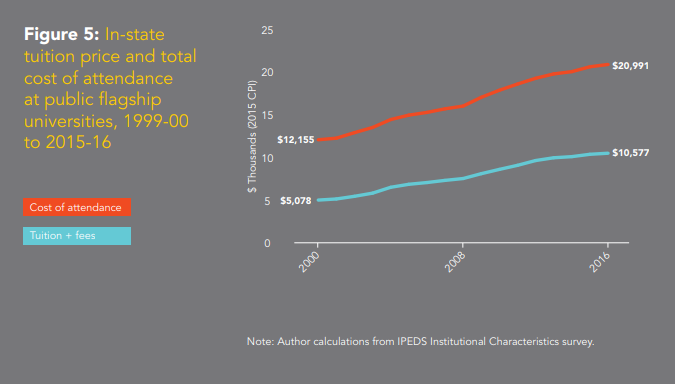
Figure 5 also shows that the average total cost of attendance (tuition, mandatory fees, room and board) now exceeds $20,000 for in-state students. A large body of research finds that in-state enrollment declines when in-state tuition price rises and moderate- and low-income students are the population most likely to be hit by high tuition prices.34,35,36,37
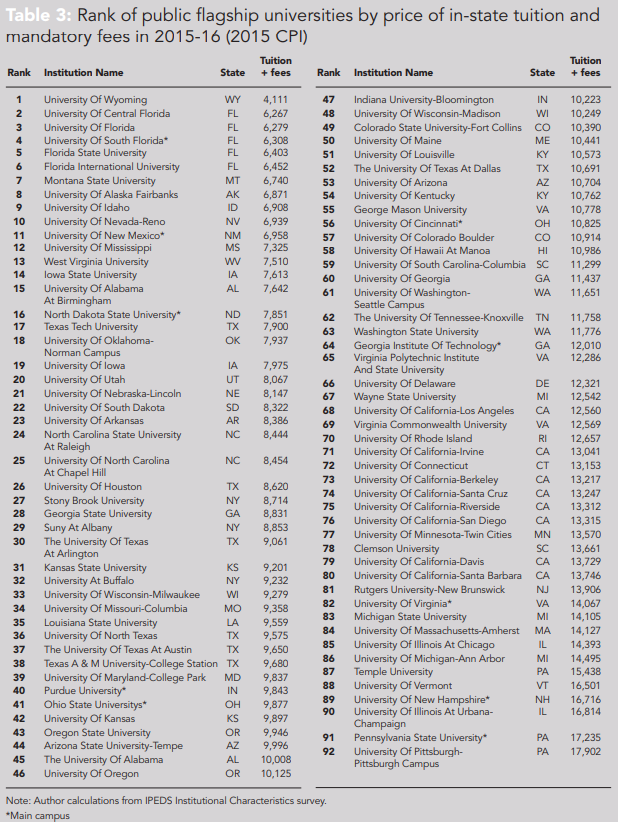
Table 3 shows that in-state tuition price differs dramatically across state universities. For example, the University of Wyoming charged in-state students $4,111 per year in 2015-16 while Michigan State University charged $14,105.
In 2014-15 households earning less than $30,000 paid about $10,500
out-of-pocket, households earning between $30,000 and $48,000 paid
about $12,000, and households earning between $48,000 and $75,000
paid about $15,670.
The University of Pittsburgh, the most expensive institution, charged in-state students $17,902! One primary consequence of raising tuition is a reduction in the number of high-achieving, moderate- and low-income students because financial aid has not kept up with tuition hikes.
In light of the growth in tuition price and total cost of attendance, low-income students require grant aid to attend public flagship universities without taking on substantial debt.
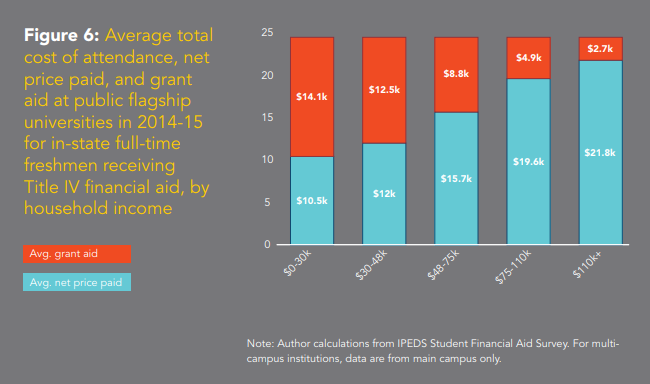
Figure 6 shows the average total cost of attendance (including tuition, fees, books, food, housing, travel, and living expenses), average grant aid (from all sources), and the average net-price paid by income group in 2014-15 for in-state full-time freshmen at public flagship universities.38
Average grant aid is higher for low-income students than high-income students and, thus, the average net price paid increases as family income increases. However, households earning less than $30,000 paid about $10,500 outof-pocket, households earning between $30,000 and $48,000 paid about $12,000, and households earning between $48,000 and $75,000 paid about $15,670. In other words, low-income families are expected to contribute more than one-third of their income, while the highest earning families are paying less than a quarter of their income. While the price paid by moderate- and low-income families is less than the price paid by affluent families, students from moderate and low-income families cannot afford to pay upwards of $10,000 annually without taking on substantial debt.
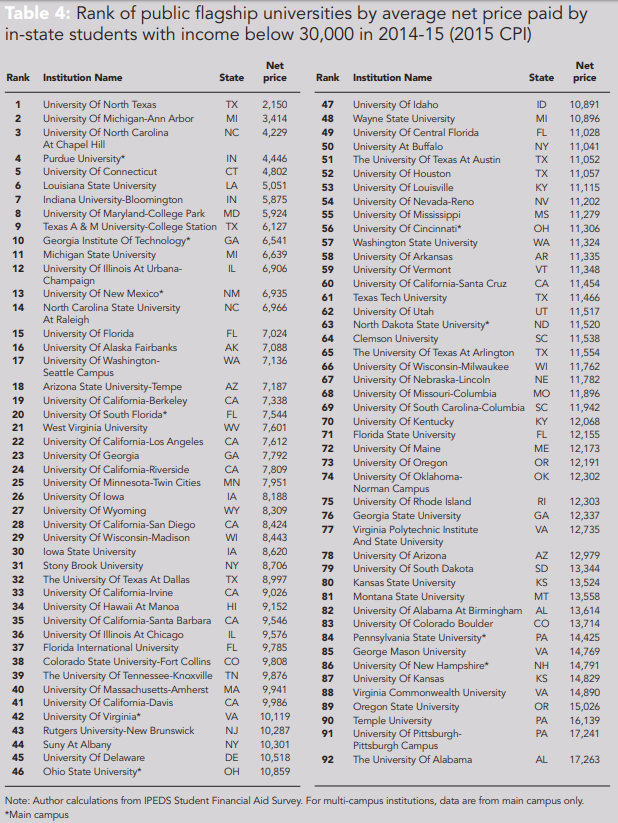
Finally, Table 4 shows that the net price paid by households with income below $30,000 differs dramatically across universities. At University of Michigan, University of North Carolina, and Purdue University, the net price paid is $5,500 or less. However, at Temple University, the University of Pittsburgh, and The University of Alabama the average net price paid by low-income households exceeds $16,000 annually. Further, the price differential can be substantial depending on where students live in the country. For example, a college degree in Vermont can cost as much as four times as much as a college degree in New Mexico.39
This is simply outrageous and not calculated to promote economic diversity on campus.
At Temple University, the
University of Pittsburgh, and
The University of Alabama the
average net price paid by
low-income households exceeds
$16,000 annually.
Further, the New York Times recently showed that 33 states have adopted performance-based funding models, which link public funding to performance measures such as graduation rates. However, these models are not evidencebased and disadvantage low-income students.40
Researchers have found that state performance funding systems do not positively affect degree completion.41,42 Worse, colleges subject to performance-based funding enrolled fewer Pell Grant recipients than colleges in states where funding was not performance-based.43 This finding has increased concern by education policy experts that “schools could game the funding system by lowering academic standards, or by shying away from low-income students with less academic preparation.”44 Therefore, the combination of state disinvestment and performance-based models creates a double disadvantage for low-income students.
For the entire population of public universities, a 10% decline in state
appropriations was associated with a 2.7% increase in out-of-state enrollment.
For public research universities, a 10% decline in state appropriations was
associated with a 5.0% increase in out-of-state enrollment.
CREATING THE OUT-OF-STATE UNIVERSITY
State legislators often rationalize cutting higher education funding by stating that universities can generate their own revenue. Figure 7 suggests that this statement is true.
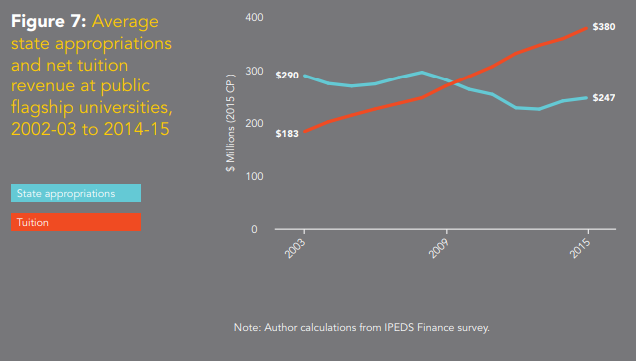
State appropriations to public flagship universities were stagnant throughout much of the early 2000s, dropped precipitously following the Great Recession, and have not returned to pre-recession levels, even after several years of economic recovery. By contrast, average net tuition has grown dramatically, surpassing state appropriations as of 2009-10, and has risen steadily ever since. However, state cuts that force public flagship universities to become tuition-reliant have important effects on their behavior and character.
Resource dependence theory, a sociological theory of organizational behavior, says, in effect, “he who pays the piper calls the tune.”45 When states are the primary revenue source, public universities focus on state goals, such as access for state residents and human capital development. When states disinvest, public flagship universities must seek alternative resource providers and the organizational mission shifts to providing value to these new paying customers. Since state policymakers set price ceilings on the in-state tuition price, public flagship universities cannot compensate for state funding cuts by simply increasing in-state tuition price and growing in-state enrollment. However, out-of-state tuition price is generally not regulated by state policymakers. It tends to be two to three times greater than in-state tuition price.46 Therefore, cuts in state funding create strong financial incentives for state public flagship universities to increase out-of-state enrollment.
Researchers Ozan Jaquette and Bradley Curs found that public universities responded to declines in state appropriations by dramatically increasing out-of-state enrollment and this negative relationship was stronger at public research universities.47 For the entire population of public universities, a 10% decline in state appropriations was associated with a 2.7% increase in out-of-state enrollment. For public research universities, a 10% decline in state appropriations was associated with a 5.0% increase in out-of-state enrollment.
Figure 8 shows that the average percentage of out-of-state freshmen has increased dramatically in the last decade, particularly at public flagship universities in the top 100 of the U.S. News & World Report rankings.
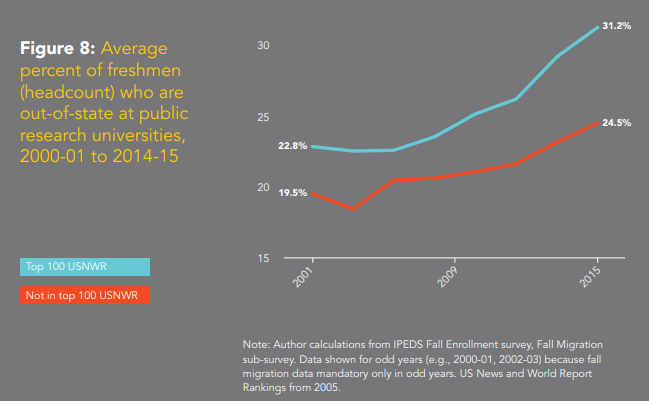
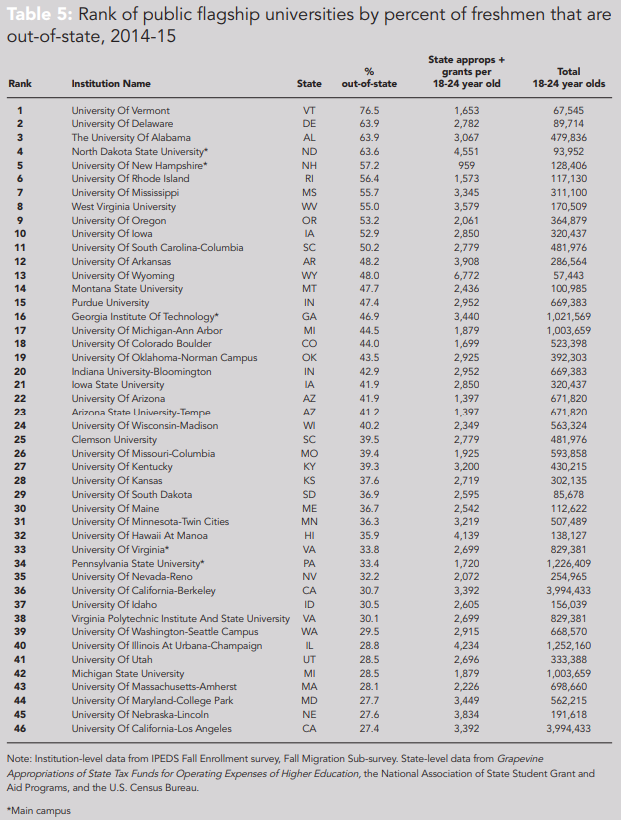
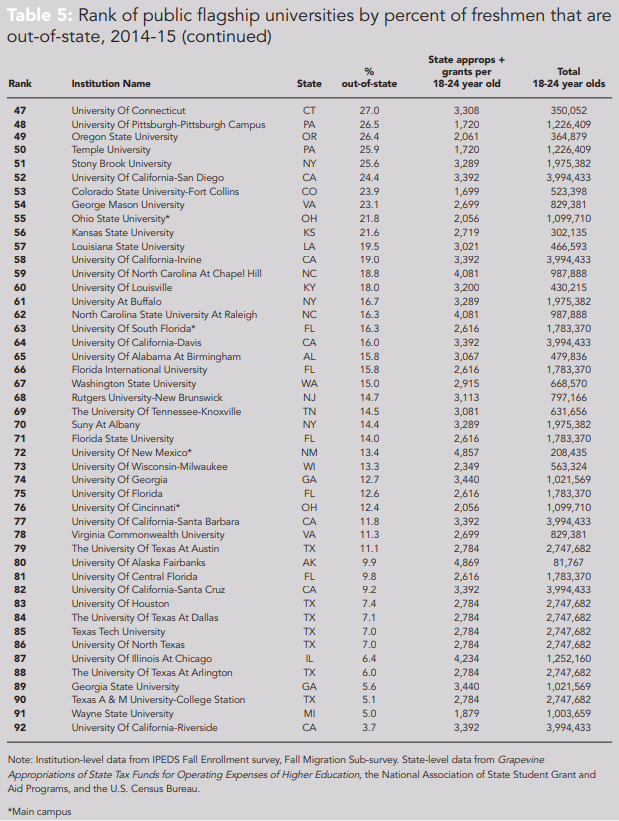
Table 5 shows the percentage of out-ofstate freshmen at each public flagship university in 2014-15. Amazingly, at 24 public flagship universities out-of-state students represent at least 40% of freshman enrollment. At 11 public flagships, out-of-state students account for more than half of all freshmen. These so-called “state” universities are misnamed and are increasingly not at all representative of their states.
How are public flagship universities attracting so many out-of-state students? They use a variety of strategies. First, they provide merit aid. A growing number of public flagship universities have dramatically increased institutional grant aid offers to out-of-state students – packaged as “merit” scholarships – as a means of convincing out-of-state students to apply and enroll.48,49,50 Non-prestigious public flagship universities (e.g., University of Arizona, University of Arkansas) have developed financial aid policies that award substantial grant aid to out-of-state applicants with undistinguished academic records, many of whom have been rejected from a public flagship university in their home state.
Second, these institutions aggressively market and recruit. Universities pay ACT and/or the College Board for the contact information of test-takers who satisfy certain minimal criteria (e.g., score range, geographic location, etc.). Universities also purchase student analytic data from for-profit search engines. Many so-called free college search engines (e.g., Niche, Parchment) sell data entered by prospective students to “data science” marketing firms (e.g., Chegg, Hobsons). Universities hire these marketing firms to identify “prospects,” and to decide which prospects should be targeted by which interventions. For example, from 2010 to 2015, the University of Alabama paid $1.2 million to the College Board and $2.7 million to the enrollment management firm Hobsons.51 Not surprisingly, from 2009-10 to 2015-16 in-state freshman enrollment at the University of Alabama declined from 3,103 to 2,508 while out-of-state freshman enrollment increased from 2,013 to 4,706.52
Third, universities attract out-of-state students with resort-like amenities. The New York Times reported that many public universities – including, Louisiana State University, Texas Tech University, and the University of Missouri-Columbia – have built pools with a “lazy river.”53 The Nation describes the “slick and shiny” University of Arizona campus: “To lure students who can afford to pay that bill, campuses are investing in resort-like amenities, even as they cut academic departments and financial aid. Thus universities meant to ameliorate social inequality are instead exacerbating it.”54 According to the Nation, in the past several years University of Arizona has opened luxury apartments with rooftop hot tubs and swimming pools, a spa where students can get massages, and a state of the art gym with flat screen TV’s and personal training packages. These upgrades reflect a shift in university spending priorities towards the tastes of affluent, out-of-state students as a result of state budget cuts. The Nation reports, “Many of the participants in this relentless campus upscaling are private businesses, but it’s driven by public policy. Like other campuses, the University of Arizona is not getting fancier in spite of budget cuts; it’s getting fancier because of them. From 2002 to 2013, state appropriations shrank from $420 million to $270 million. Over the same period, the amount raised from student tuition grew from $179 million to $455 million.”
Amazingly, at 24 public flagship
universities out-of-state students
represent at least 40% of freshman
enrollment. At 11 public flagships,
out-of-state students account for
more than half of all freshmen.
In turn, out-of-state enrollment growth has sparked policy debates across the country. Many state policymakers have become concerned that out-of-state enrollment growth “crowds out” enrollment opportunities for in-state students, particularly the high-achieving, moderate- and low-income students.55,56 Public flagship universities counter that tuition revenue from out-of-state students enables them to finance in-state access amidst state budget cuts.57 Research by Bradley Curs and Ozan Jaquette investigated the effect of out-of-state enrollment growth on in-state enrollment.58 They found that out-of-state enrollment growth had no effect on in-state enrollment at less-prestigious public flagship universities. However, at prestigious public flagship research universities (e.g., University of Michigan and the University of California at Berkeley), out-of-state enrollment tends to crowd-out in-state residents. To put the results in context, out-of-state enrollment at prestigious public flagship research universities grew by 80 students per year on average from 2012-13 to 2014-15. Our models suggest that these 80 additional out-of-state students crowded out 46 in-state students annually.
Out-of-state enrollment at
prestigious public flagship research
universities grew by 80 students
per year on average from 2012-13
to 2014-15. Our models suggest
that these 80 additional out-of-state
students crowded-out 46 in-state
students annually.
Out-of-state enrollment growth alters campus socioeconomic and racial composition.59 Data from the National Postsecondary Student Aid Study (NPSAS) show that out-of-state students tend to be richer than in-state students, are more likely to have parents with a baccalaureate degree, and are more likely than in-state students to be white or Asian, and less likely to be black or Latino. Researchers Ozan Jaquette, Bradley Curs, and Julie Posselt found that growth in the share of out-of-state freshman at public research universities was also associated with declines in the share of Pell Grant recipients and the share of underrepresented minority students.60 The negative relationship between the percentage of out-of-state students and the percentage of Pell Grant recipients was stronger at prestigious public research universities and stronger at universities located in states with high poverty rates.
To give a more concrete representation, at many public research universities the percentage of out-of-state students increased by more than 10 percentage points (e.g., from 20% out-of-state to 30% out-of-state). Our models found that a 10 percentage point increase in out-of-state students was associated with a 1.7 percentage point decline in the share of Pell Grant recipients (e.g., from 25% Pell to 23.3% Pell). For prestigious public flagship research universities, this same increase in the share of out-of-state students was associated with a 2.7 percentage point decline in the share of Pell Grant recipients (e.g., from 25% Pell to 22.3% Pell). Thus, the aggressive shift towards out-of-state enrollment by many public research universities is associated with socioeconomic uniformity which, in turn, is associated with negative student development outcomes for moderate- and low-income students.61,62
How do out-of-state students compare to in-state students academically? In some cases, the out-of-state population performs less well. NPSAS data show that out-of-state students tend to have higher SAT/ACT scores, but in-state students tend to have higher high school GPAs.63 Further, retention studies from individual institutions tend to find that out-of-state students have higher dropout rates than in-state students, particularly at less-selective public universities.64,65 These trends support the idea that less-prestigious public flagship universities are enrolling affluent out-of-state students who tend to score reasonably well on standardized tests but have unimpressive high school grades and do not take college as seriously as in-state students. In great numbers, these students can adversely change the academic and social climate experienced by high-achieving, low-income students.66 This is troublesome (a) for the talented, low-income student who does not have the income to attend elsewhere, (b) for the institution that is being changed by the very presence of these out-of-state (presumably lower-achieving) students, and (c) likely disturbing to the local taxpayers if they knew that their erstwhile state university was serving primarily out-of-state students.
LIFE AT THE “OUT-OF-STATE” UNIVERSITY
What is life like at the flagship state university for high-achieving, low-income students? In “Paying for the Party: How College Maintains Inequality,” Elizabeth Armstrong and Laura Hamilton paint an alarming picture.67 The authors conducted a five-year ethnographic study of the lives of 50 undergraduate women who were freshmen at the same residence hall at a public flagship university in the Midwest. Data analysis revealed that these young women followed one of three pathways: the professional pathway, the mobility pathway, or the party pathway. The professional pathway consisted of affluent, high-achievers pursuing careers in medicine, science, and the law. The mobility pathway consists of working-class students, usually the first in their family to attend college, aspiring for middle-class life. The party pathway views college as a party and is associated with (mostly) affluent students, unchallenging majors, and doing as little schoolwork as possible. Despite their lack of effort, affluent students following the party pathway (55% of the sample) were successful obtaining professional jobs, primarily because of personal connections, while working-class students following the party pathway fared poorly.
Tragically, working-class students who
transferred to regional campuses
achieved greater social mobility than
those who remained at the flagship
university because they were not
surrounded by the affluence, social
pressure, and anti-intellectualism of
the party pathway.70
Armstrong and Hamilton found that the party pathway dominated institutional spending priorities.68 The party pathway was characterized by affluent students with low academic achievement, who were often from outside the state. In order to attract these students, the university spent lavishly on facilities (e.g., luxury dorms and fitness centers) and big-time collegiate sports. More funding devoted to “country club” amenities meant less funding to student services targeting the needs of working-class students on the mobility pathway. The party pathway also dominated academic life because it was “built around an implicit agreement between the university and students to demand little of one another.”69 Students on the party pathway lowered academic standards by collectively refusing to put forth more effort, by ostracizing students who try to perform academically, through course evaluations, and by enrolling in “easy” classes and majors. Gradually, professors also learn to avoid rigorous coursework, and working-class students feel conspicuous about putting forth effort. The party pathway also dominated the social life. Affluent students on the party pathway had the time and the money to spend on sorority dues, dinners out, drugs, and alcohol and were the most visible constituency on campus. Affluent students on the professional pathway were able to dabble in the party pathway or ignore it altogether, but working-class students often felt excluded, like outcasts.
Tragically, working-class students who transferred to regional campuses achieved greater social mobility than those who remained at the flagship university because they were not surrounded by the affluence, social pressure, and anti-intellectualism of the party pathway.70
Not every university follows this pattern, of course. But the risk exists that the institution will reach a tipping point where serious academic pursuits become secondary, and the aspiring students from modest means will not be able to achieve their goals of social mobility for themselves and their families. That is the risk of relying on full-paying outsiders to balance the books.
This shift in institutional mission – from a focus on social mobility for talented, hard-working local students to a focus on creating a party atmosphere for intellectually uncurious rich kids – is happening at public flagship universities across the nation. Policy discourse on access inequality for high-achieving, low-income students tends to look at non-prestigious public flagships (e.g., University of Arizona and the University of South Carolina) with disdain because of their lack of selectivity.71 But public flagship universities are the preeminent higher education institutions in the state, the ones responsible for educating future professionals, economic leaders, and civic leaders. For local first-generation students, attending the state flagship university is a big deal, and a point of pride in the community. Unfortunately, many talented first-generation students never make it to their public flagship university because of state policies that track them into community colleges and because of university recruiting behaviors that prioritize rich kids from out of state. Furthermore, first-generation students who are able to matriculate at their state flagship university are bombarded by a student culture that values affluence and eschews hard work. University of Michigan professor Elizabeth Armstrong writes, “when campus cultures come to be defined by the cultural styles and tastes of affluent, out-of-state students, this has consequences for the sense of inclusion on campus of low-income students. Lowincome students observe the expensive cars, clothes, and leisure of affluent students and too often get the message that only students with means belong on campus.” When administrators think they can recruit out-of-state students to generate revenue at no cost to the university, they are wrong. There is a big cost to the character of the university and to the working-class families these universities were created to serve.