Equal Talents, Unequal Opportunities, Second Edition: A Report Card on State Support for Academically Talented Low-Income Students
What We Did
This project began in 2014. In conjunction with an advisory board of national experts familiar with the landscape of state policy as it relates to advanced learning, the project team compiled a master list of indicators that could be used to evaluate the extent to which state-level policies are in place, the degree to which students are participating in targeted interventions, and students’ success in attaining advanced levels of achievement.6 We organized these indicators into a project logic model (Figure 1), and selected 28 of these indicators to include in this year’s report.
We are pleased we were able to include more indicators this year than previously. Fifteen indicators from the 2015 report and 13 new indicators are included in this year’s report (Figure 2).7 This report also improves upon the 2015 report with the inclusion of data on student participation, to measure opportunity gaps.
In a major departure from the earlier report, we have grouped indicators separately into measures of Excellence (achieving advanced educational learning outcomes for all students) and Closing Excellence Gaps (decreasing discrepancies between a state’s low-income students and other students in reaching advanced levels of achievement). Policies were mapped to these two areas based on recent research on policy effectiveness; if there is demonstrated evidence that a policy leads to smaller excellence gaps, then that policy was listed as an excellence gap measure.
A well-taken criticism of the earlier report was the degree to which a state with favorable excellence policies and data but a poor track record with excellence gaps could score well overall. Separating “Excellence” from “Closing Excellence Gaps” better allows us to highlight states that are doing well in both areas. It also allows for a state to score well in its support and outcomes for advanced learners in general, but score poorly for support and outcomes related to excellence gaps. The ability to highlight any such discrepancies is a major improvement in this line of research and also explains why states may perform quite differently across the two iterations of the report.
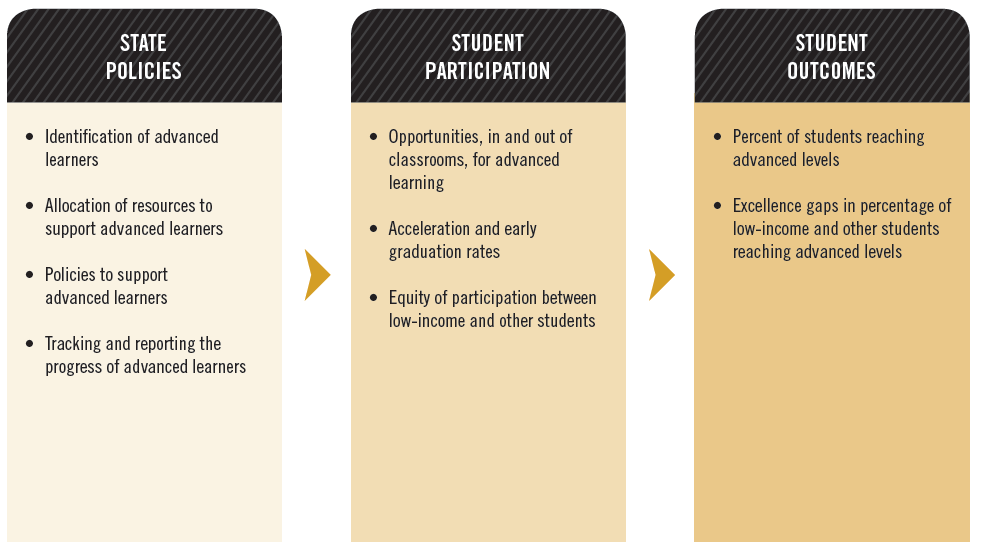
Figure 1: Project Logic Model
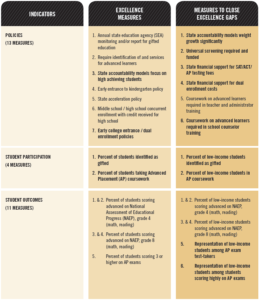
Figure 2: Indicators Used in This Report. Items in bold are new to this report in 2018.
Methods and Limitations
Project staff compiled a database to record each variable for all 50 states plus the District of Columbia. Data were drawn from multiple online and documentary sources (Appendix A).8 When critical data were missing, project staff contacted state education agency (SEA) staff directly, and if that effort was unsuccessful, we used data from earlier versions of the targeted data sets.
Much of the policy data are self-reported by SEA officials on various surveys. Self-reported data have well-known limitations, but the consistency of responses across the past few administrations of the surveys, in combination with random checks of the responses by the research team, provide a level of confidence in the reliability and validity of those data.
The biggest limitation of this report is the lack of available data on the education of advanced students, especially as it relates to excellence gaps and low-income students and their families. Many of the indicators recommended by the expert panel are not readily available, and in some cases the data of interest do not appear to be publicly available.9
In the following section, we describe our grading approach and our findings of the extent to which states have implemented these policies and achieved these desired outcomes.
Grading System
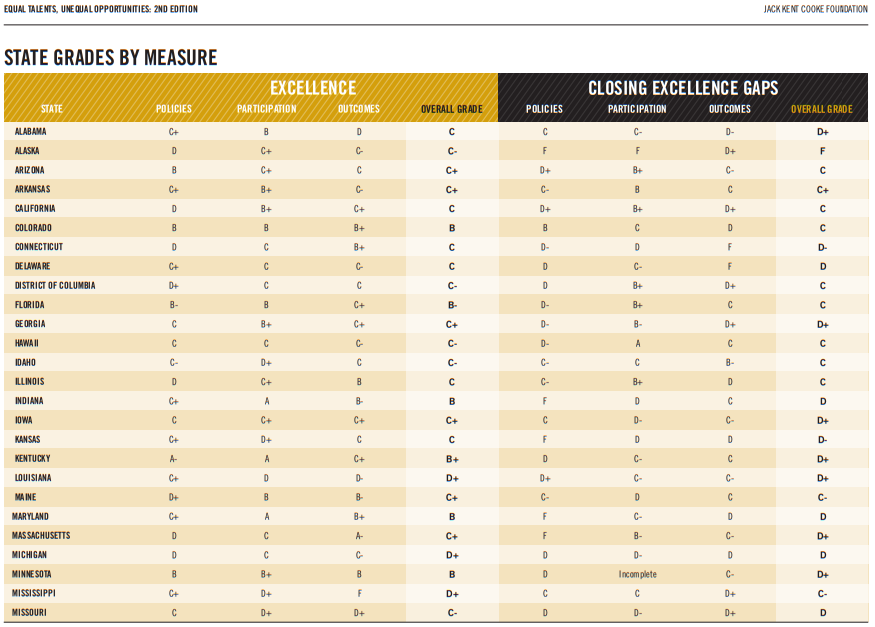
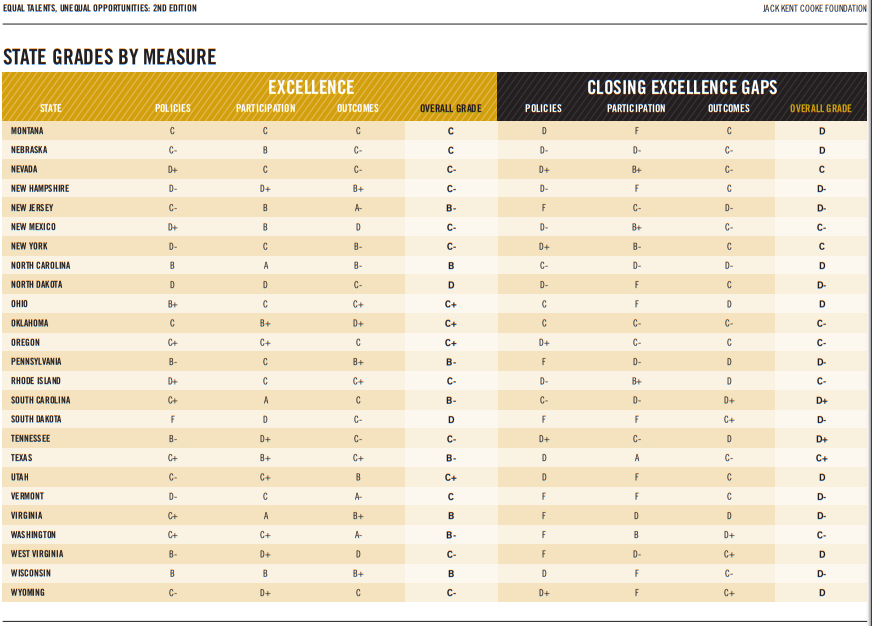
Every state receives eight grades in this report: two overall grades, and six measure grades (Figure 3). The first two grades measure broadly the extent to which we observe progress in states:
- Excellence Grade: the extent to which states promote and achieve learning for their high-ability students
- Closing Excellence Gaps Grade: the extent to which states ensure that low-income students have equal access to advanced learning opportunities and are equally likely to achieve high levels of academic excellence as other students
To maximize this report’s usefulness, we calculate six additional measure grades to assess each state’s policies, participation, and outcomes as they relate to excellence and excellence gaps.
Excellence Measures:
- Policies that support excellence
- Participation rates of all students in advanced learning opportunities
- Outcomes of all students at the advanced level
Excellence Gap Measures:
- Policies that help close excellence gaps
- Participation rates of low-income students in advanced learning opportunities
- Outcomes of low-income students at the advanced level
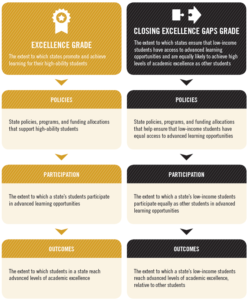
Figure 3: Grading System
Results
Supporting Excellence
Figure 4 presents the state grades for EXCELLENCE, i.e., the extent to which states promote and achieve learning for their high-ability students. Fourteen states receive a grade of B or better for their work supporting excellence. Four of these states (Colorado, Minnesota, North Carolina, and Wisconsin) had strong results across all three grading areas — policies, participation, and outcomes (Figure 10). The remaining states had more mixed results. Nationwide, the average excellence grade was a C.
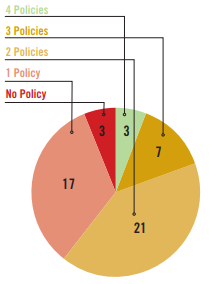
Since our first report, we see modest improvement among states implementing policies that support excellence. All states have at least two of the seven policies intended to promote excellence in place; 10 states have all seven (Figure 5). The most frequently observed policy was “identifying and serving advanced students,” now required in 33 states (up from 32 in 2015). On average states had five of the seven policies. Of course, a raw count of policies does not account for the strength of policies. Strength and degree of implementation are considered in the detailed results presented later in this report.
New to this year’s report are participation indicators. In 2015, participation data were difficult to find. They proved equally difficult in the preparation of the current report, and we relied on proxy variables to provide at least some sense of how participation compares among states. We included two measures of overall participation for excellence: identification for gifted services, and participation in Advanced Placement (AP) courses. Nationwide, on average 6 percent of students are identified for gifted services. Participation is higher for AP courses; on average 29 percent of states’ high school graduates took an AP Exam during high school.
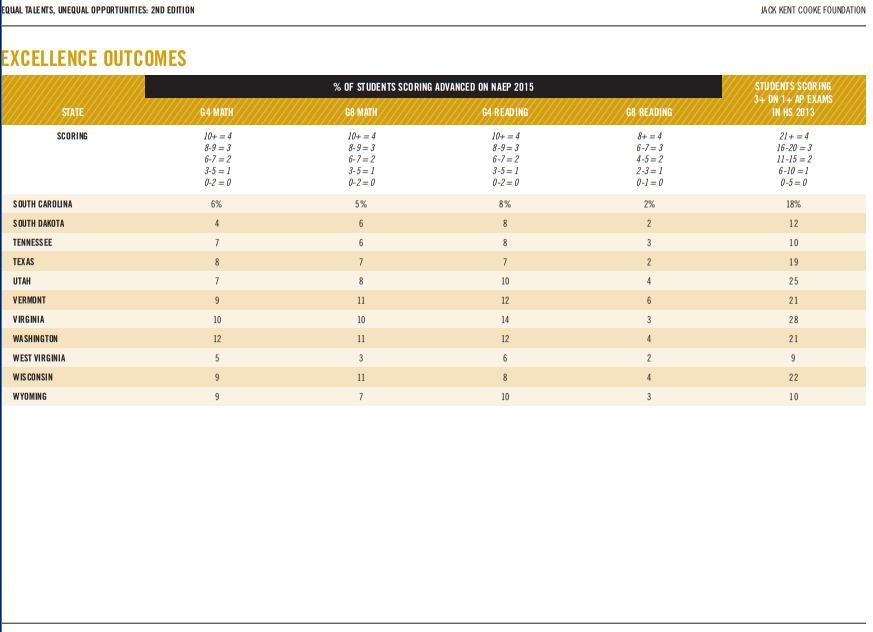
We included the same five outcome measures as the first report: grades 4 and 8 math and reading, and high school AP test results. Outcomes are mixed. Some states have strong outcomes, with over 10 percent of elementary or middle school students scoring “advanced” on the National Assessment for Education Progress (NAEP). The exception is grade 8 reading, where very few students seem to excel. Compared to two years ago, fewer states report high outcomes in grades 4 and 8; one more state scored highly on the AP measure.
Overall, the excellence measures of this report paint a mixed picture of progress when it comes to supporting learning at the advanced level. States are beginning to require supportive policies, students are participating, and outcomes in 18 states are high.

Figure 4: State Grades for Excellence. The extent to which states promote and achieve learning for their high-ability students.
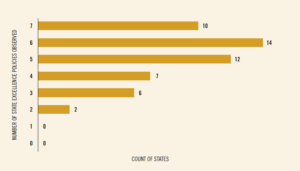
Figure 5: Number of Policies States Have Implemented to Support Excellence
Closing Excellence Gaps
The picture is starkly different when we examine EXCELLENCE GAPS. Not a single state in the nation received a good grade for closing excellence gaps (Figure 6). In fact, the average grade across the nation was a D+.
The consistently low grades for excellence gaps — in all 50 states and the District of Columbia — stems from a lack of pertinent policies and from abysmally poor advanced learning participation and outcomes among states’ low-income students relative to their peers (Figure 10). Indeed we saw only one state (Colorado) receive a B for policies, and one (Idaho) receive a B for outcomes.
Six excellence gap policies were examined, policies that remove financial or administrative barriers that might keep low-income students from accessing advanced learning opportunities. No state has all six policies in place (Figure 7). Colorado alone has five of the six; only 13 other states have even half of the policies in place. On average states have mandated only two of the six policies.
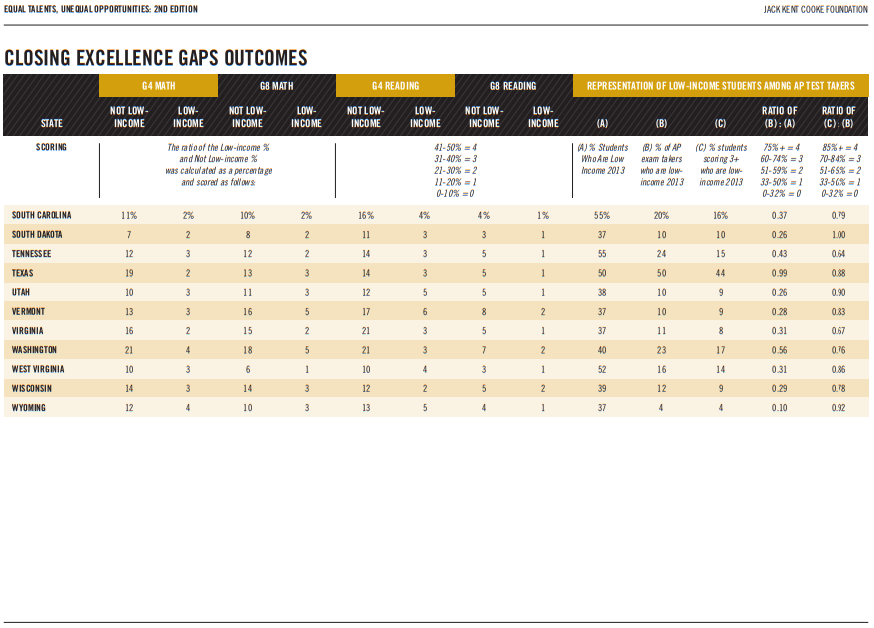
To measure participation of low-income students in advanced learning, we sought to include two indicators: the percentage of low-income students identified as gifted, and the percentage of those who take AP tests. Unfortunately, the U.S. Department of Education does not report on gifted education by socioeconomic status. Thus we only included a single participation measure, and the results are mediocre: in only 10 states are low-income students even somewhat represented among AP exam takers (Figure 9, Page 12). Texas alone has equal representation of low-income students among its AP exam takers as its student body generally. This may be attributable to Texas’ robust AP subsidy program, which provides test fee subsidies to students and reimbursement of teacher training costs.
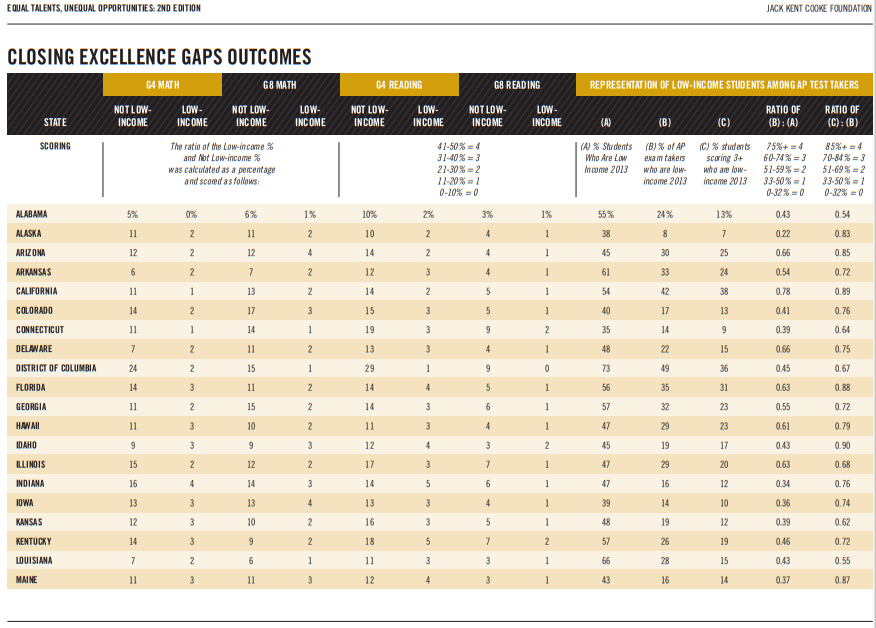
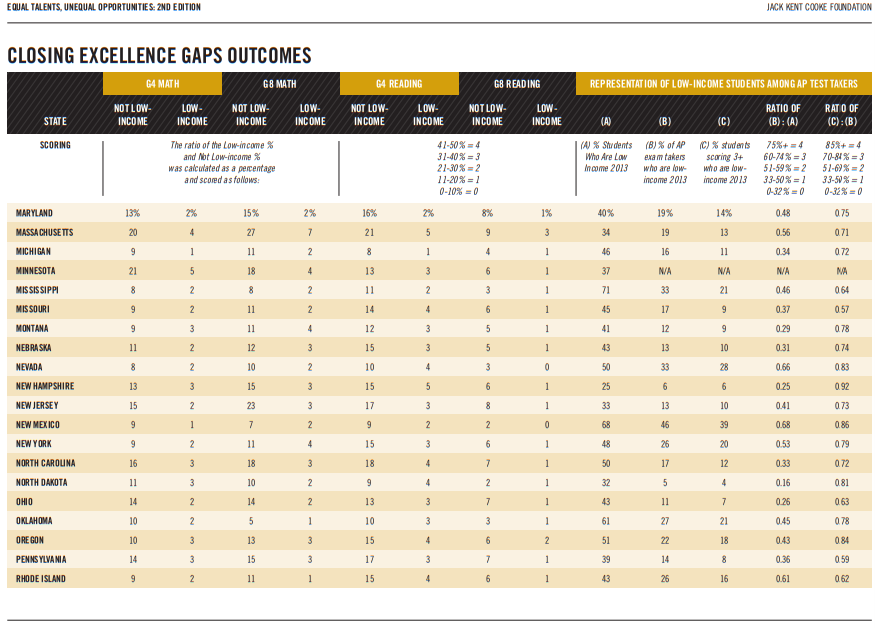
Results are even worse for outcomes. Every state in the nation has excellence gaps — in grade 4, grade 8, and high school; in math and in reading (Figure 8). These excellence gaps range in size. In grades 4 and 8, in math and reading, we observe state excellence gaps as small as 1 percent (North Dakota, grade 8 reading) and as large as 28 percent (District of Columbia, grade 4 reading). In other words, in the District of Columbia, only 1 percent of low-income students score at the advanced level in grade 4 reading, while 29 percent of other students do so!
These examples highlight a stark reality: the size of excellence gaps is driven primarily by how well other students perform, relative to their low-income peers. In the case of excellence gaps, a rising tide does not raise all boats. Regardless of how well other students do, the percentage of low-income students scoring at the advanced level hovers around 2 to 3 percent, and is never higher than 7 percent (Massachusetts, grade 8 math).
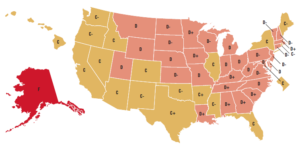
Figure 6: State Grades for Closing Excellence Gaps. The extent to which states ensure that low-income students have equal access to advanced learning opportunities and are equally likely to achieve high levels of academic excellence as other students.
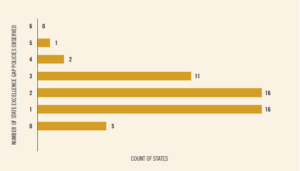
Figure 7: Number of Policies States Have Implemented to Close Excellence Gaps.
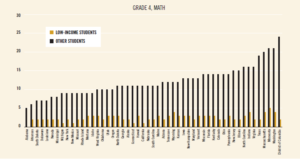
Figure 8a: Outcome Excellence Gaps, Grade 4, Math and Reading. Source: Percentage of students scoring at the “Advanced” level. National Assessment of Education Progress, 2015.
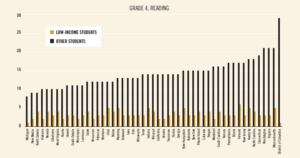
Figure 8b: Outcome Excellence Gaps, Grade 4, Math and Reading. Source: Percentage of students scoring at the “Advanced” level. National Assessment of Education Progress, 2015.
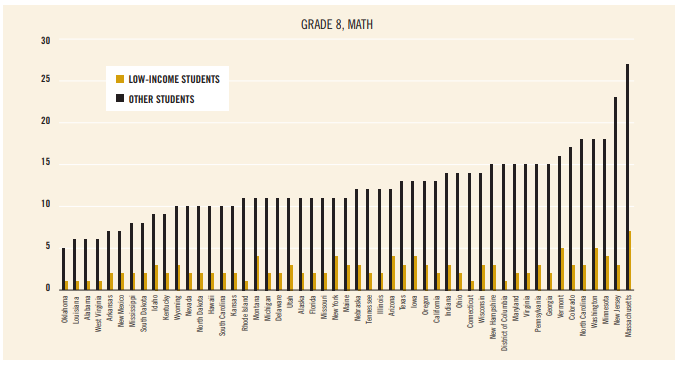
Figure 8c: Outcome Excellence Gaps, Grade 4, Math and Reading. Source: Percentage of students scoring at the “Advanced” level. National Assessment of Education Progress, 2015.
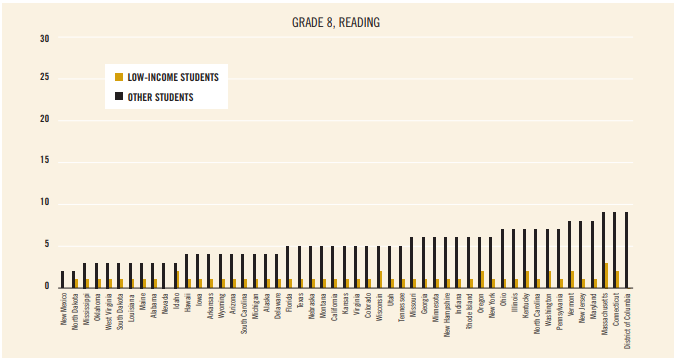
Figure 8d: Outcome Excellence Gaps, Grade 4, Math and Reading. Source: Percentage of students scoring at the “Advanced” level. National Assessment of Education Progress, 2015.
Data Results and Indicators
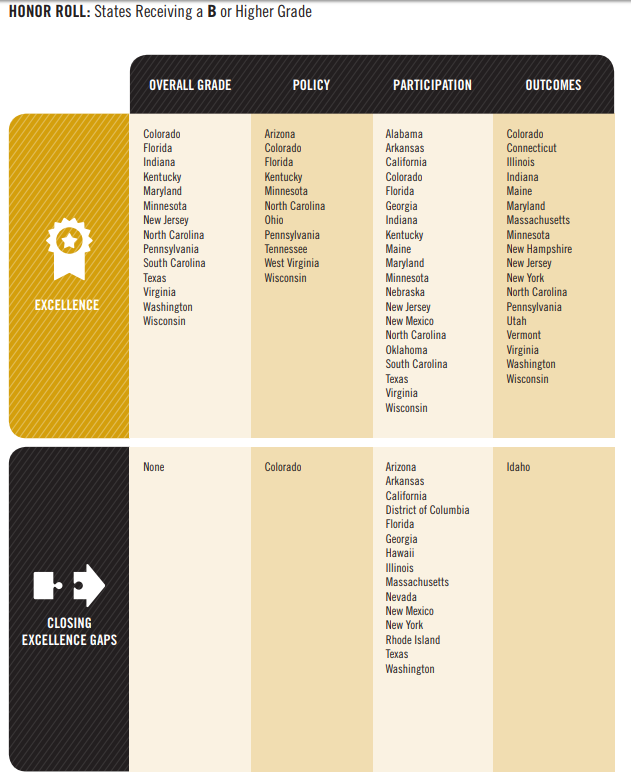
There is hope, though. When we look at each state across the six measure areas (i.e., policies, participation, and outcomes related to either excellence or closing excellence gaps), we see tremendous variation. Thirty-eight states received a B or higher in at least one measure (Figure 10). Figures 11 through 16 present the national results for each measure, and Appendix B contains state-by-state results. On every indicator, at least some states are doing well. So although practices and results range widely among and within states, we see signs of progress.
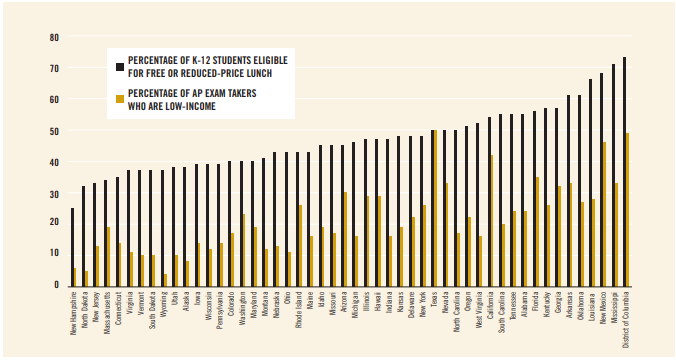
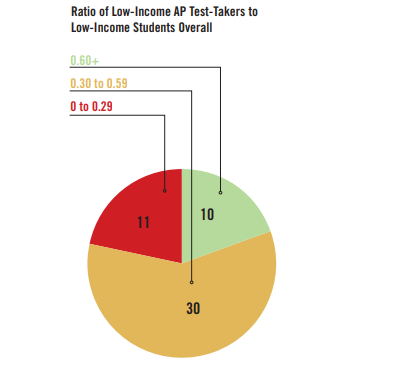
Figure 9: Participation Excellence Gaps, AP Exam Takers. Source: The 10th Annual AP Report to the Nation, College Board, 2014.
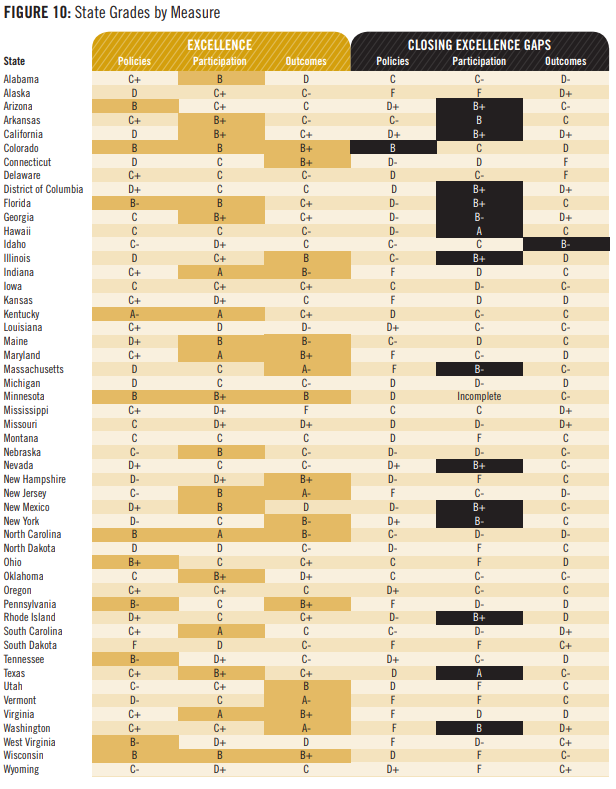
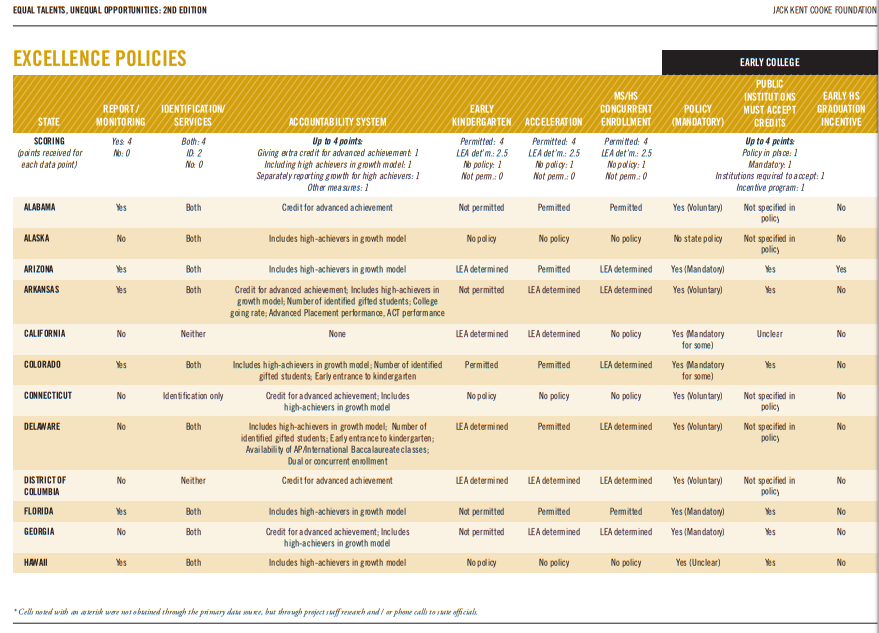
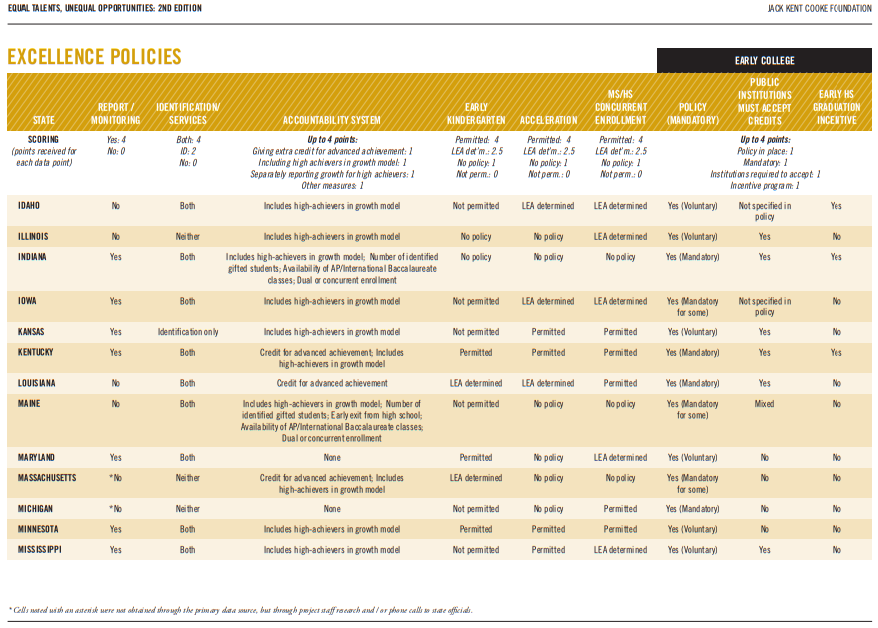
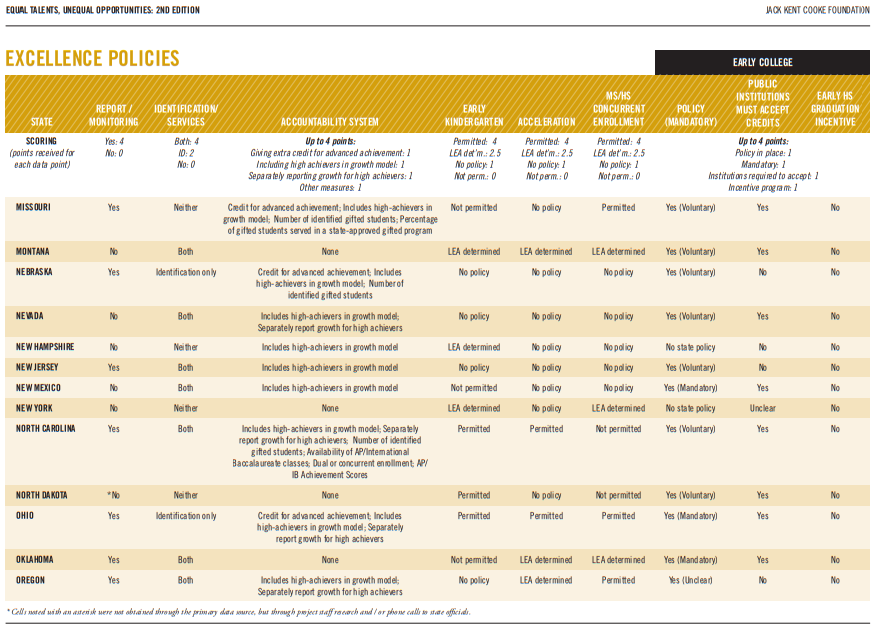
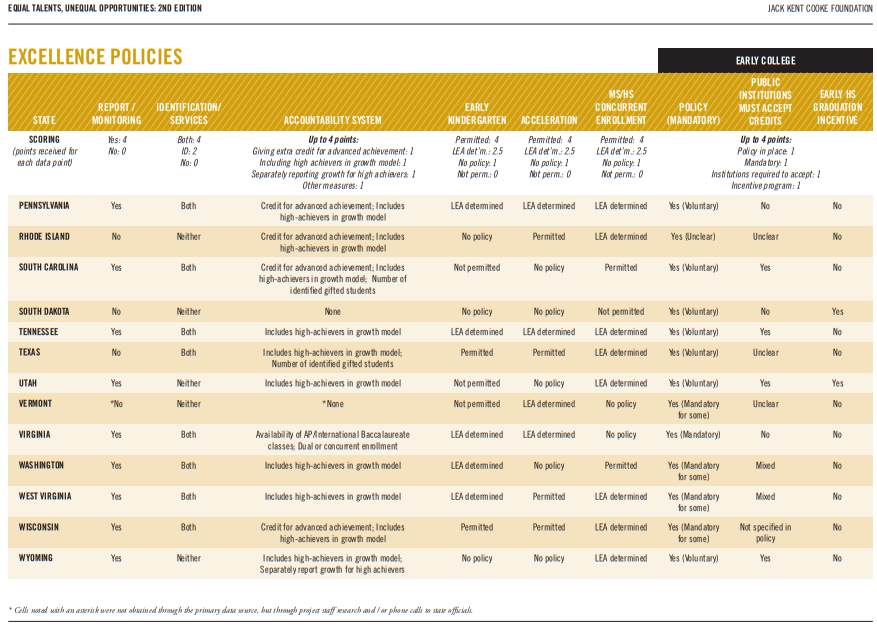
Figure 11: Policies Promoting Excellence - To what extent do state policies support and facilitate advanced learning for all students?
Excellence Policy Indicator 1:
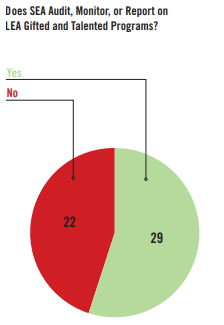
State produces an annual report on gifted and talented (G&T) programs or monitors/audits local G&T programs
A state that emphasizes advanced education should have some form of state-level monitoring for related Local Education Agency (LEA) programs and interventions. States received full credit on this indicator if they reported either monitoring/ auditing LEA gifted education services or preparing an annual report on the “state of the state” regarding advanced education.
Progress since 2015: Slightly Positive. One additional state monitors, audits, or reports on advanced education.
Source: NAGC State of the States Report, 2014-2015 (“NAGC report”)
Excellence Policy Indicator 2:
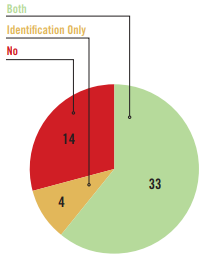
State mandates identification or services for identified advanced learners
Requiring identification and service delivery for advanced students is an indicator of the value a state places on academic excellence, including for low-income students who may be attending schools in which proficiency is valued more highly than advanced performance. States received full credit on this indicator if they require services (i.e., with identification implied), and partial credit if they only require identification.
Progress since 2015: Slightly Positive. One more state has added requirements for identification and services.
Source: NAGC report
Figure 11 (cont'd): Policies Promoting Excellence
Excellence Policy Indicator 3:
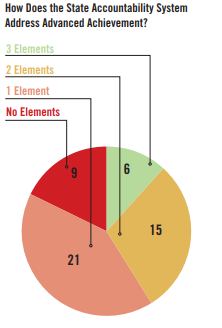
State accountability system includes measures of advanced learning and excellence
State K–12 accountability systems drive the priorities of our schools, yet they traditionally focus only on low-achieving students and minimum competency. The inclusion of indicators representing high levels of academic performance is a strong, formal statement of the importance of advanced education, especially when those indicators give schools and districts credit for helping low-income students achieve at high levels. We used four characteristics of each state’s accountability system to derive an accountability excellence score: whether the system gives credit for advanced achievement; includes high achievers in its growth model; separately reports growth for high achievers; and includes other indicators of excellence (e.g., number of identified gifted students, AP participation and outcomes, availability of AP/IB classes, dual/concurrent enrollment, career/ technical education, graduation rates, college-going rates, SAT/ACT performance). States received full credit if all four characteristics were in place.
New indicator.
Source: Fordham Institute report, “High Stakes for High Achievers” (“Fordham report”), 2016; state accountability plans as described in policy documents
Excellence Policy Indicator 4:
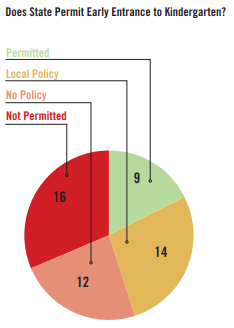
State policy allowing early entrance to kindergarten
Children should be able to enter kindergarten when they are intellectually ready to do so, not only when their birthday falls on the correct side of an arbitrary cut-off date. This may be especially important for low-income students, who may benefit from additional educational supports and social services that are available in K–12 schools. States were given full credit on this indicator if they have a state policy that allows early entrance to kindergarten, partial credit if they leave such policy decisions to local districts, slight credit if they have no applicable policies, and no credit if they expressly forbid it.
Progress since 2015: Mixed. The number of states who forbid early entrance to kindergarten has decreased from 20 to 16, but the number of states with formal policies permitting early entrance to kindergarten has decreased from 11 to 9. As a result, there has been a shift towards no policy or local control policies.
Source: NAGC report
Figure 11 (cont'd): Policies Promoting Excellence
Excellence Policy Indicator 5:
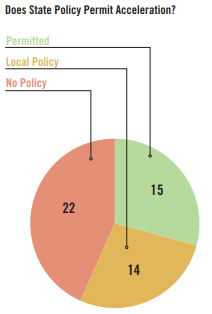
State acceleration policy
Students should be able to move through the K–12 system at their own pace. For some students, this pace can be considerably accelerated, and the benefits of academic acceleration are well documented.10 Having a state acceleration policy both sends a strong message that acceleration is valued and permissible and provides a policy lever for educators and parents to use when they encounter anti-acceleration bias. States were given full credit on this indicator if they have a state acceleration policy, partial credit if they leave such policy decisions to local districts, slight credit if they have no applicable policies, and no credit if they expressly forbid it.
Progress since 2015: Positive. The number of states requiring all schools to allow acceleration has increased from 9 to 15. Delaware, Florida, Kentucky, Mississippi, Rhode Island, and Wisconsin have all added policies permitting acceleration.
Source: NAGC report
Excellence Policy Indicator 6:
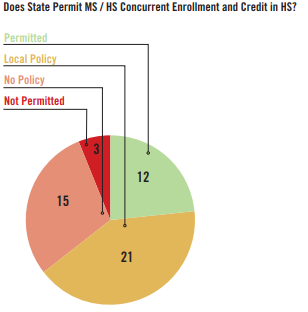
Middle school / high school concurrent enrollment and credit in high school
Having access to high school courses while attending middle school provides students with challenging coursework that their school may not otherwise be able to offer. This may be especially important for low-income students, who are more likely to attend schools with limited resources, therefore restricting advanced options in the middle school. Students who take high school coursework while in middle school should also be able to get high school credit, allowing them to move through the K–12 system at a more appropriate pace and experience greater enrichment opportunities when they enter high school. States were given full credit on this indicator if they have policies that specifically allow middle school / high school dual enrollment, and if the state allows for such enrollment to result in the granting of high school credit. States received partial credit if they leave such policy decisions to local districts, slight credit if they have no applicable policies, and no credit if they expressly forbid it.
Progress since 2015: Mixed. While the number of states forbidding concurrent enrollment dropped by three, five fewer states have state-wide policies permitting it.
Source: NAGC report; Acceleration Institute
Figure 11 (cont’d): Policies Promoting Excellence
Excellence Policy Indicator 7:
Early college / dual enrollment policies
Allowing talented students to move through high school at an accelerated pace is both educationally desirable and potentially cost saving. Some states encourage early graduation and entrance into college, and others support dual enrollment programs that allow students to complete college coursework while still in high school. A robust early college / dual enrollment system has the potential to accelerate achievement for many students. We used four characteristics of each state’s policies to derive this score: whether the state has a dual enrollment policy in place; whether dual enrollment is voluntary or required in every high school in the state; whether public postsecondary institutions are required to accept students’ dual enrollment credits; and whether the state has an early graduation incentive policy. Only three states have all four policies in place: Indiana, Kentucky, and Arizona.
New indicator.
Source: Education Commission of the States and Jobs for the Future reports (“ECS reports”); state policy documents
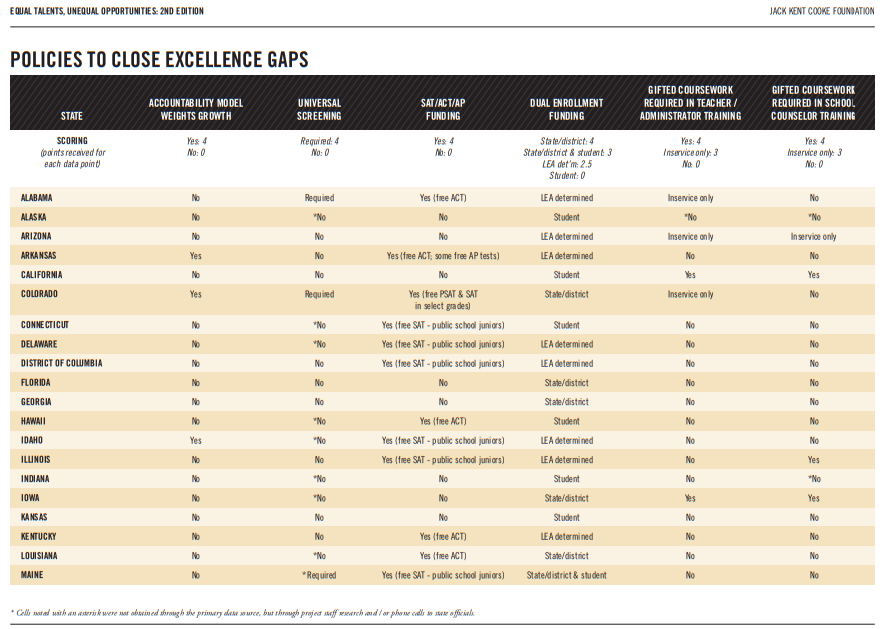
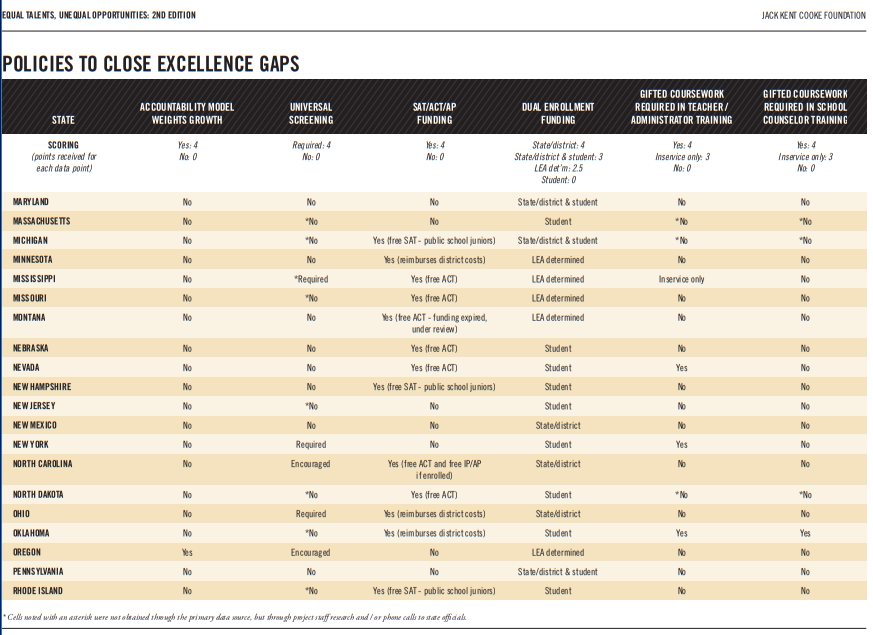
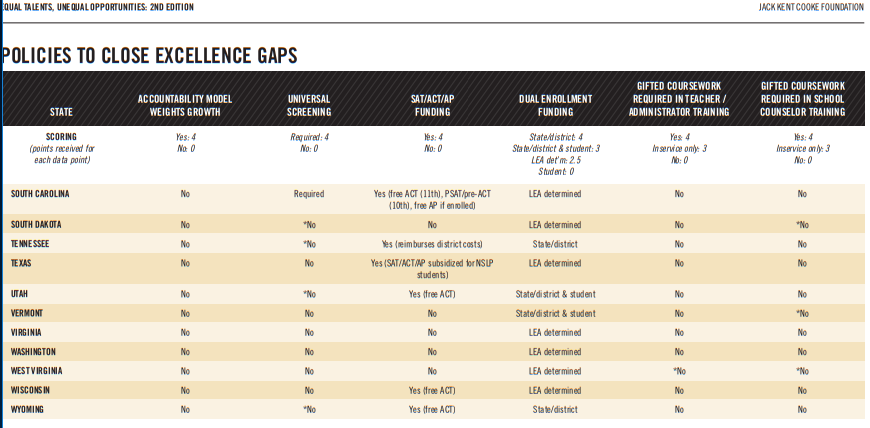
Figure 12: Policies to Close Excellence Gaps - To what extent do state policies support and facilitate advanced learning for all students regardless of student income?
Excellence Gap Policy Indicator 1:
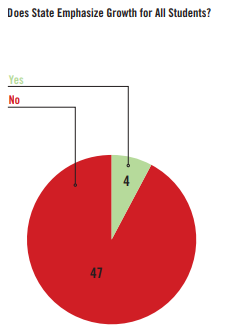
Prominence of growth for every student in state accountability system
A state accountability system may encourage schools to focus on excellence without incentivizing educators to address excellence gaps. For this indicator, states received full credit for ensuring that at least half of a school or district’s accountability rating is based on growth for all students (as opposed to growth for just lower-performing students).
New indicator.
Source: Fordham report
Excellence Gap Policy Indicator 2:
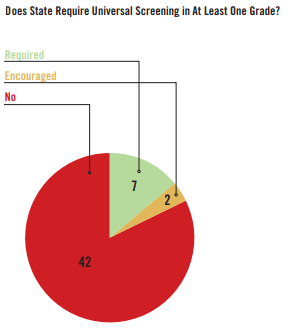
State policy for universal screening
In the three years since our last report, research support for universal screening has significantly increased. Universal screening is the practice of putting every student in a targeted grade through the identification process for gifted education and talent development programs. Research provides evidence that non-universal screening tends to exclude low-income students, therefore increasing excellence gaps.11 We initially intended this indicator to represent whether a given state offered dedicated funding for universal screening, but only one state does so (Colorado). A handful of states do require or encourage universal screening and financially support its implementation through a range of other mechanisms. The indicator was modified so states that require universal screening in at least one K–12 grade received full credit, or partial credit for “encouraging” it.
New indicator.
Source: State policy documents; NAGC report
Figure 12 (cont’d): Policies to Close Excellence Gaps
Excellence Gap Policy Indicator 3:
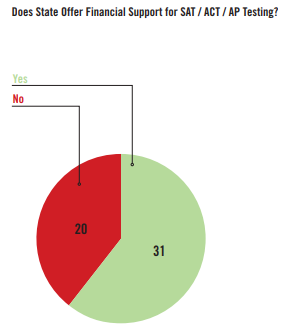
Financial support for SAT / ACT / AP testing
The fees associated with AP tests and college entrance examinations can be a major obstacle for low-income students. Many states have recognized this barrier to excellence and have enacted policies that provide at least some relief from fees associated with these “gatekeeper” tests. States received full credit for providing financial assistance for the costs associated with at least one test.
New indicator.
Source: NAGC report; state policy documents
Excellence Gap Policy Indicator 4:
Financial support for dual enrollment costs
Dual enrollment may be an effective strategy for promoting advanced achievement for high school students, but fees and tuition costs associated with dual enrollment may serve as barriers that grow excellence gaps. States received full credit for having policies that relieve students of this burden entirely, partial credit for policies that require students to cover some of the costs or that cede the decision to local control, and no credit for placing the whole financial burden on students and their families.
New indicator.
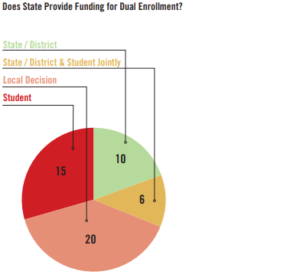
Figure 12 (cont’d): Policies to Close Excellence Gaps
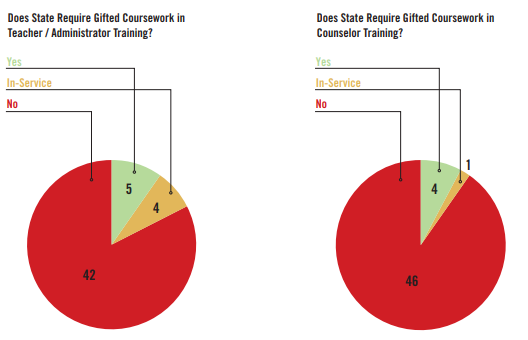
Excellence Gap Policy Indicators 5 and 6:
Gifted coursework required in teacher, administrator, and counselor training
If educators are not exposed to material on the education of high ability students, it is unlikely that those educators will be sensitive to the needs of those students, especially those who are low-income. For indicator 5, states were given full credit on this indicator if they require coursework on gifted and talented learners in pre-service training or administrator training; for indicator 6, full credit if they require coverage in school counselor training. Partial credit was awarded on indicator 5 if gifted coursework is required as part of in-service teacher training, as in-service training is often less rigorous than pre-service training.
Progress since 2015: Positive. The number of states requiring at least one of these groups to take coursework on gifted learners has risen from 3 in 2015 to 10 in 2018.
Source: NAGC report
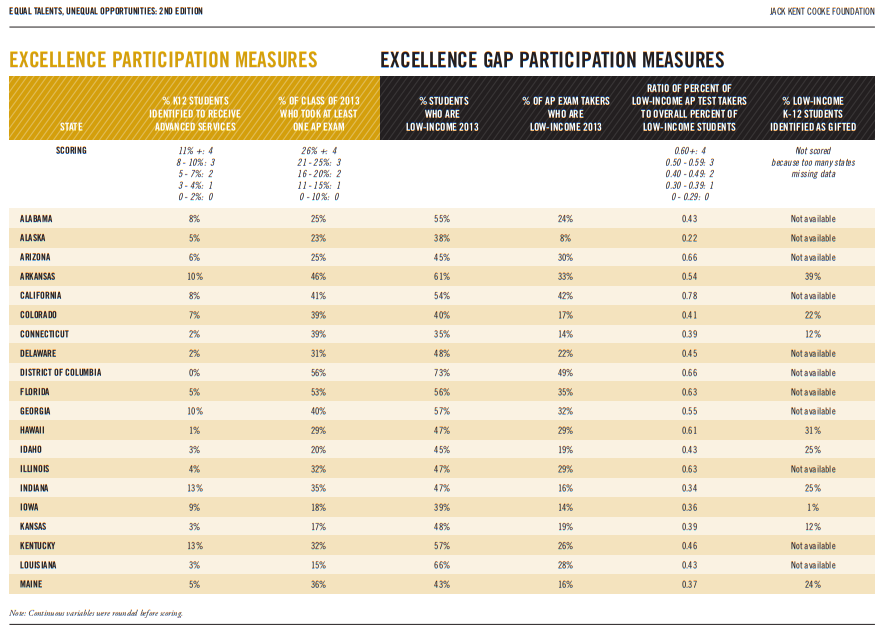
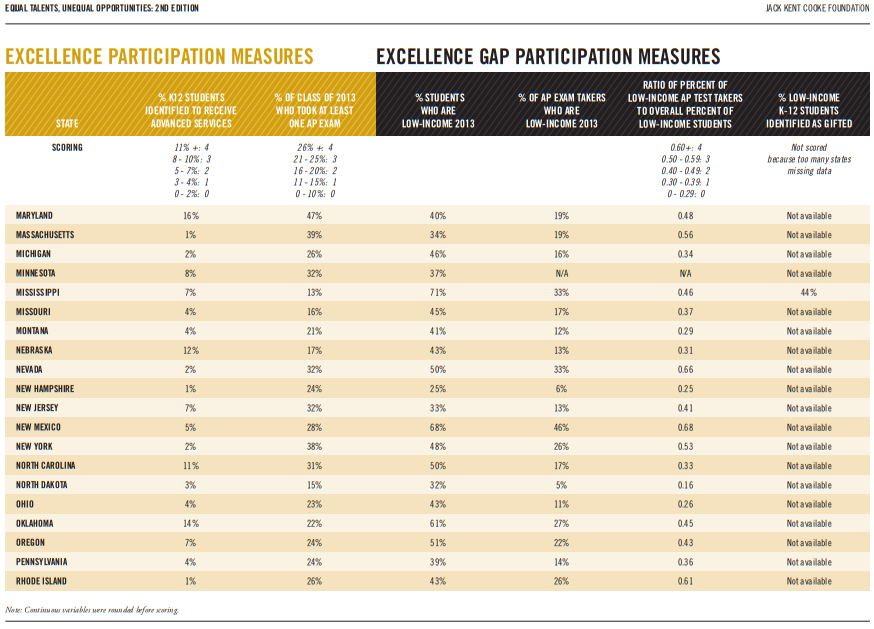
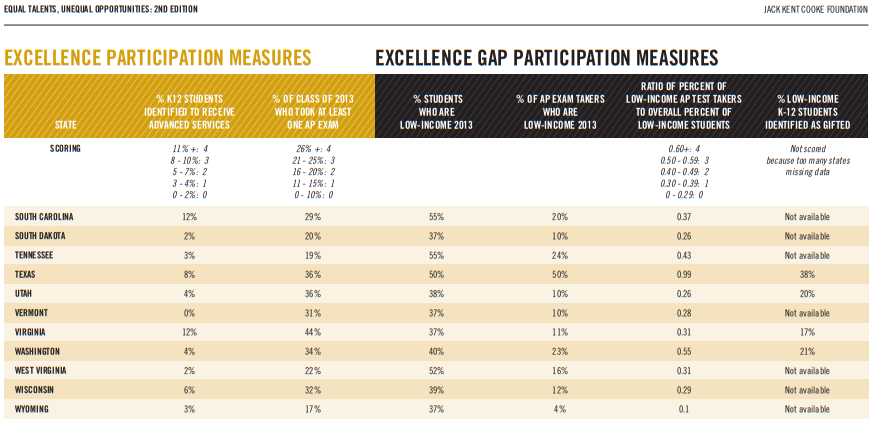
Figure 13: Excellence Participation - To what extent do students participate in advanced learning?
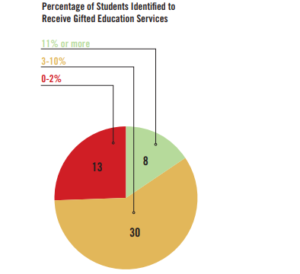
Excellence Participation Indicator 1:
Percentage of students identified to receive gifted education services
The percentage of students receiving services via gifted education is an indicator of the extent to which a state is promoting educational excellence. Each state received full credit for having 11 percent or more of its students identified as gifted and talented, with partial credit for 3 to 10 percent, and no credit for 2 percent or less.
New indicator.
Excellence Participation Indicator 2:
Percentage of graduates who took at least one AP test
Similarly, the rate at which states’ high school graduates take AP tests is an indicator of participation in rigorous programs at the high school level. States received full credit for AP test-taking rates of 26 percent or more, partial credit from 11 to 25 percent, and no credit for 10 percent or less.
New indicator.
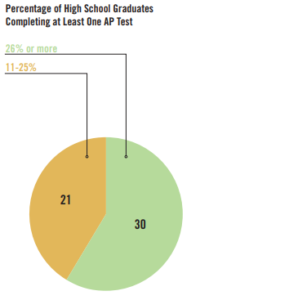
Figure 14: Excellence Gap Participation - To what extent do low-income students participate in advanced learning?
Excellence Gap Participation Indicator 1:
Representation of low-income students among AP test takers
In schools with small excellence gaps, the percentage of low-income students who take at least one AP test should be similar to the percentage of low-income students in the school system. States received full credit on this indicator if the ratio of low-income test-takers to low-income students was 0.60 or higher, partial credit for 0.30 to 0.59, and no credit for 0.29 or less. For example, a state with 60 percent lunch assistance overall and 30 percent of AP test-takers receiving lunch assistance has a ratio of 0.50. A state with no underrepresentation would have a ratio of 1.0.
New indicator.
Excellence Gap Participation Indicator 2:
Percentage of low-income students identified as gifted
We intended to include an indicator representing the percent of each state’s gifted education population that are from low-income backgrounds. However, the U.S. Department of Education’s Office of Civil Rights (OCR) only collects data on student race and not socioeconomic status, and very few states report such data. Several report that the data are not available or not collected. This is a major limitation in the country’s education data and should be addressed by all states. This indicator was not factored into the ratings in this report, but we include the spotty data in the summary data tables (see Appendix B) as an encouragement to states and OCR to address this issue.
New indicator.
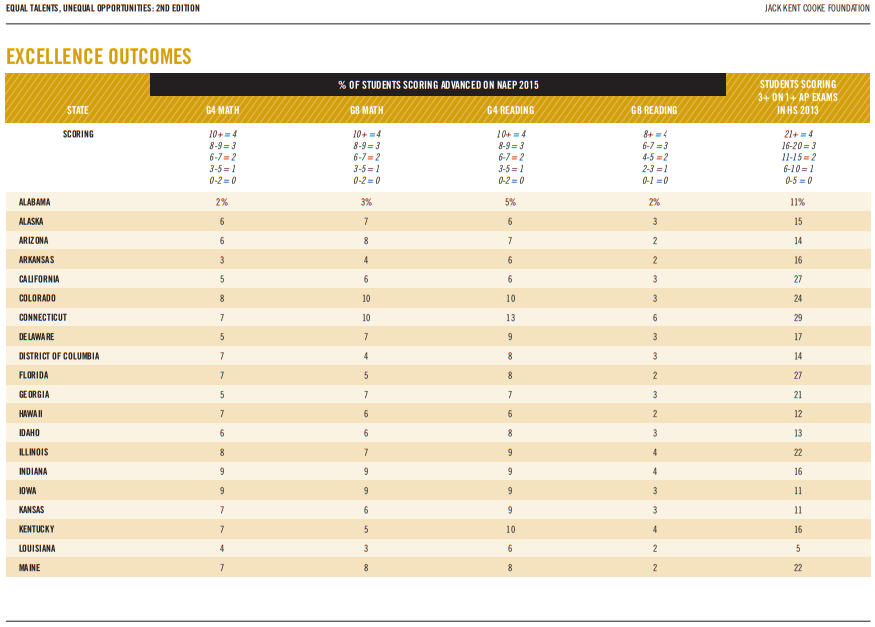
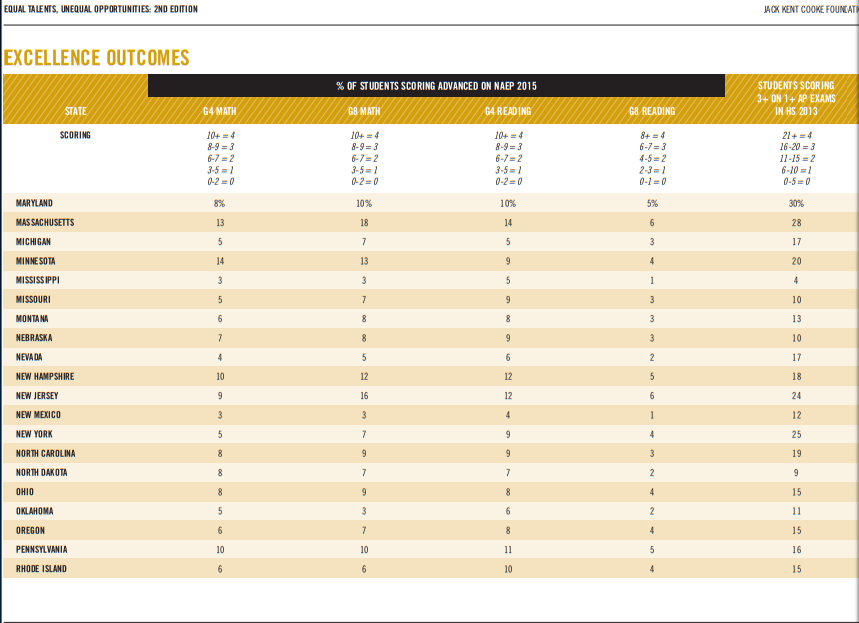
Figure 15: Excellence Outcomes - To what extent do students reach advanced levels of performance?
Excellence Outcome Indicators 1-5:
Advanced achievement for all students
A key outcome is the percent of public school students who perform academically at advanced levels. We included indicators on student performance at several levels: NAEP math and reading data for grade 4 and grade 8, and AP exam data to represent high school achievement. Although we collected grade 4 and 8 NAEP science data, the advanced performance levels on science were so low among all states that providing a non-punitive rating would have been impossible.
To receive full credit on these indicators, state data needed to reflect:
- At least 21 percent of students scored 3 or higher on at least one AP exam
- At least 10 percent scored in the advanced range (grade 4 and 8 math, grade 4 reading)
- At least 8 percent scored in the advanced range (grade 8 reading).12
The four NAEP achievement indicators contributed to two-thirds of each state’s excellence outcome grade, with AP performance representing the remaining third.
Progress since 2015: Negative in grades 4 and 8. Fewer states this year report high percentages of students reaching the advanced level than two years ago. Positive in high school. One more state scored highly on the AP measure.
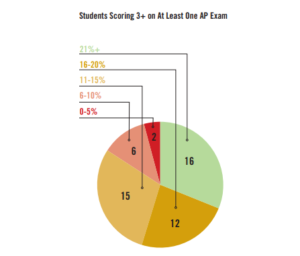
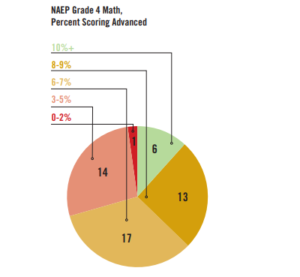
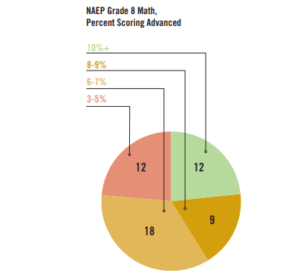
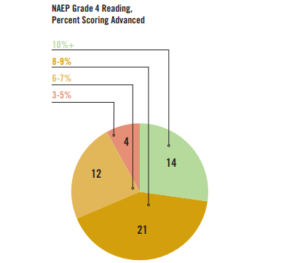
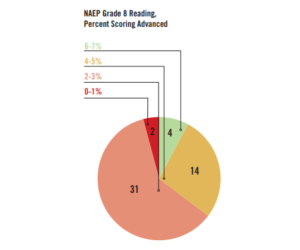
Figure 16: Excellence Gap Outcomes - To what extent does the performance of low-income students differ from their peers at advanced levels?
Excellence Gap Outcome Indicators 1-6:
Advanced achievement for low-income students versus non-low-income students
High levels of academic progress do not necessarily mean that all student subgroups share the same levels of accomplishment. If a state has a relatively large percent of students scoring advanced on NAEP, but most of those students are not low-income, the state is not promoting educational excellence for all.
To receive full credit on these indicators, state data needed to reflect three conditions:
- The percent of students scoring 3 or higher on an AP test who were low-income was at least 75 percent of the level of low-income students in the state
- The percent of students scoring 3 or higher on an AP test who were low-income was at least 85 percent of the level of low-income students who took an AP test
- A state’s NAEP data showed that the percent of low-income students scoring advanced had to be at least 41 percent of the percent of non-low-income students scoring advanced (grade 4 and 8 math, grade 4 and 8 reading)
Progress since 2015: Mixed. The grade 8 scores are slightly improved, while the grade 4 scores are worse. The AP measures are new this year.
Source: NAEP, AP report
Note: Minnesota is missing its data on AP participation, thus the two AP charts sum to 50, not 51.
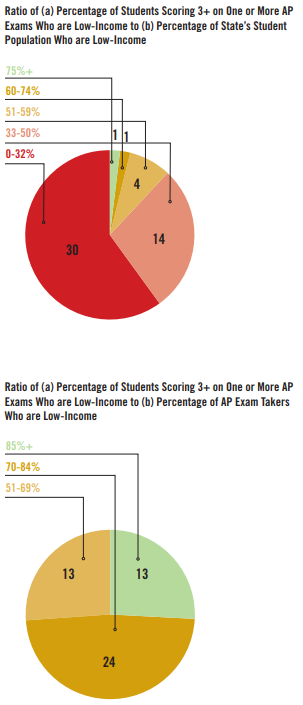
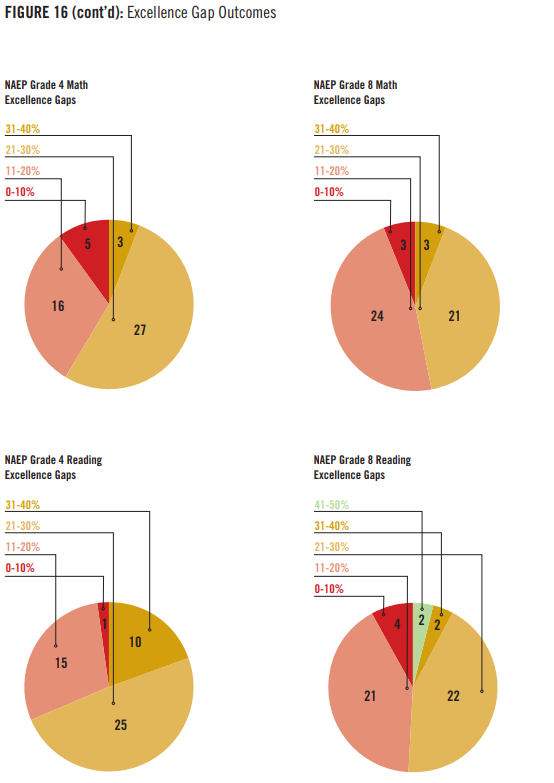
Figure 16 (cont'd): Excellence Gap Outcomes
Appendix B
STATE DATA TABLES
The following tables report the specific indicators for each state’s policies, participation measures, and outcomes. State values were rounded before scoring. Cells noted with an asterisk were not obtained through the primary data source, but through project staff research and/or phone calls to state officials.