True Merit: Ensuring Our Brightest Students Have Access to Our Best Colleges and Universities
True Merit
The admissions process used today in America’s most selective colleges and universities is a classic case of interest group politics gone awry. Athletic coaches lobby for athletes. Trustees advocate for students who are the children of potential donors. Faculty members lobby for the children of other faculty and for high scoring students, who tend to be wealthy. And nobody champions or fights for smart, low-income students.
The result is an admissions process reduced to a series of preferences. Taken together with other widely-used admissions practices, such as allowing applicants who take the SAT multiple times to submit only their highest scores, these preferences are part of a system that is profoundly unfair to top students from low-income families. Access to our nation’s best colleges and universities is increasingly a function of wealth and station, not academic merit.
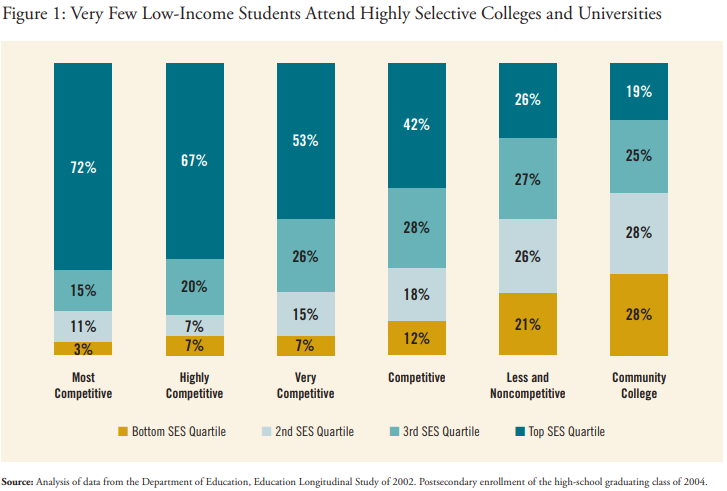
It comes as no surprise therefore that American postsecondary education is highly stratified by socioeconomic class, with 72 percent of students in the nation’s most competitive institutions coming from families in the wealthiest quartile.1 High-achieving, students from the bottom socioeconomic quartile are only one-third as likely to enroll in selective colleges and universities compared to those from the top socioeconomic quartile.2 In short, we are relegating our brightest minds from low-income families to attend institutions with fewer resources, lower graduation rates, lower paying employment prospects, and reduced access to the upper echelons of leadership and commerce. This unequal treatment cheats the striver out of obtaining the best education available and denies society at large the benefits of having the most educated workforce possible. It’s a story of demography determining destiny.
This past December 2015, the United States Supreme Court began re-evaluating the role of race-conscious affirmative action in college admissions with the re-argument of the case of Fisher v. University of Texas. For the second time, the Court is reviewing the constitutionality of the University’s admissions program. The fact that the Supreme Court has chosen to hear the case again does not bode well for race-conscious considerations in college admissions.3 There is no better time to examine how selective colleges and universities choose their students, particularly as our research suggests many admissions criteria unfairly prevent many of our most talented low-income students from gaining admittance.
Although individual aspects of college admissions have been analyzed before, in this report we for the first time comprehensively analyze the entire admissions process as it impacts the high-achieving, low-income applicant to a selective college or university. Our conclusion: the deck is stacked against them, notwithstanding the advent of “need-blind” admissions and the claims made by selective colleges and universities that they are trying to accommodate the low-income student. We find that there is significant evidence that most low-income students lack the information to navigate admissions practices effectively and that many top low-income students, because of “sticker shock,” are deterred from even applying to highly selective schools. We conclude that the preferences and some other admissions practices at highly selective colleges and universities, taken together, have resulted in a surprising, and probably inadvertent, result:
Being admitted to a selective institution is actually harder for the high-achieving, low-income students than for others.
We were also surprised by both the extent of the individual disadvantages and the uniformity of approach across all highly selective colleges and universities reviewed. On the other hand, we were encouraged to find that the vast majority of high-achieving, low-income students who do manage to enroll in selective colleges and universities succeed at a high level.
To address the problems uncovered, we believe that selective colleges and universities should institute a preference for otherwise qualified students who come from low-income families. Such an approach would recognize that to overcome the burdens of poverty and nonetheless perform at a high level is itself an indicator of ability and perseverance; true merit, properly understood, recognizes both scholastic achievement and the importance of the distance traveled from a low-income high school to an elite college or university.
National data and Cooke Scholars
confirm that the vast majority of
high-achieving, low-income students
who enroll in selective colleges and
universities succeed at a high level.
Unfortunately, too few of them enroll.
If the Supreme Court limits the extent to which institutions can rely on race-conscious affirmative action, reliance on a preference for low-income students will be an important admissions criterion to insure diversity in their entering classes. Not only—in the words of President Obama—is there still an “intersection” between race and income in this country, but our dramatically decreasing social mobility makes emphasis on economic indicators all the more imperative.
About this Report
This report is divided into four sections. First, we demonstrate that high-achieving, low-income students are underrepresented at selective institutions. Next, we explain why they do not apply in greater numbers and what role the students’ knowledge about the admissions process plays. In the third section, we review how the selection process itself—with its preferences and other practices—disadvantages high-achieving, low-income students. In the final section, we suggest strategies selective institutions should use to recognize the merit of high-achieving, low-income students, drawing on practices that some institutions have employed to maintain diversity on their campuses in response to state-bans on race-conscious affirmative action.
Terminology
This report focuses on admissions at selective colleges and universities; those that receive more applications than they accept and whose enrolled students have high levels of academic preparation. In our research, we utilize the Barron’s Profiles of American Colleges classification system, combining the “Most Competitive” and “Highly Competitive” classifications to identify the nation’s top selective schools. In 2015, there were 91 “Most Competitive” and 102 “Highly Competitive” institutions. For details on the classifications, please see Appendix A.
We define high-achieving as those students who scored in the top academic quartile on a 10th grade reading and mathematics assessment administered as part of the Education Longitudinal Study and who graduated from high school. We acknowledge that students attending the most selective institutions often come from the top 10 to 20 percent of their class. However many students at those colleges and universities come from below the top academic decile and perform well. Moreover, low-income students who score in the top 25 percent despite facing myriad hurdles, are likely to have as much or greater academic potential in the long run as students who look better on paper but have been given many advantages. To capture these extraordinary low-income students in our sample, we generally use a top 25 percent cutoff.
Within this group of high-achieving students, we compare the experiences of students from families with greater or lesser financial and social capital. Our analyses use a composite measure of socioeconomic status (SES) based on family income, parents’ highest level of educational attainment, and parents’ occupational status. SES is often used instead of income both because income is not adjusted for cost-of-living variations, which can be significant as one moves about the country, and because, in surveys, a student’s reported knowledge about her parents’ occupation and education level may be more precise than the knowledge of her parents’ income. Additional research referenced in this report sometimes uses income quartiles to divide students. For simplicity’s sake, throughout this report, we use the phrase low-income to refer to students in the bottom SES or income-quartile. For details on the data sources and methods, please see Appendix B.
Underrepresentation
High-Achieving, Low-Income Students Are Underrepresented at Selective Institutions
The selectivity of higher education institutions attended by students in this country directly correlates with their family’s SES (Figure 1). Students from families in the bottom economic quartile comprise only three percent of enrollment in the most competitive schools, while those from the top economic quartile comprise 72 percent.
This situation has not improved in recent years,4 despite selective institutions’ well-advertised increased commitment to “need-blind admissions” and “no-loan financial aid” packages.5 Our analysis of the latest institutional data available from the U.S. Department of Education reveals that the underrepresentation of lower-income students at highly selective colleges has not changed significantly in the past ten years.
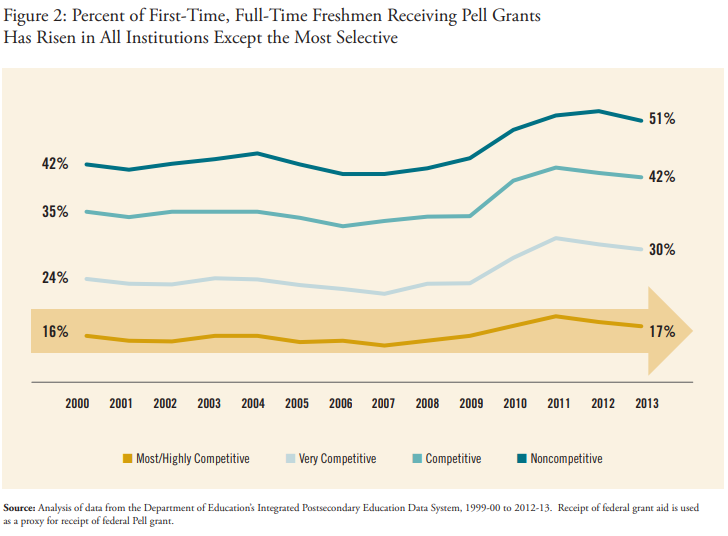
Federal Pell funding increased dramatically under the Obama Administration.6 As a result, more students received the Pell grant amount for which they were eligible, and Pell enrollment increased dramatically.7 Yet, while the percent of students receiving Pell grants has risen in other sectors of higher education, it has not increased appreciably in selective colleges, suggesting that the number of low-income students has in fact remained static (16 percent in 2000; 17 percent in 2013) (Figure 2).
Skeptics might say these disparities reflect differing levels of academic preparedness or ability. Certainly it’s true that wealthy students—who grow up in affluent neighborhoods, attend well-resourced schools, participate in after-school enrichment, and attend summer programs at their parent’s expense—are more likely to emerge from high school well-prepared for the rigors of a selective college education. Analysis of average SAT scores by family income makes this clear.8
Yet hidden within these numbers are thousands of students from economically disadvantaged households who, despite attending less-resourced schools and growing up with less intellectual stimulation and advantages, do extremely well in school, love learning, are extraordinarily bright and capable, and would do very well at selective institutions if offered admissions. They are just being ignored.
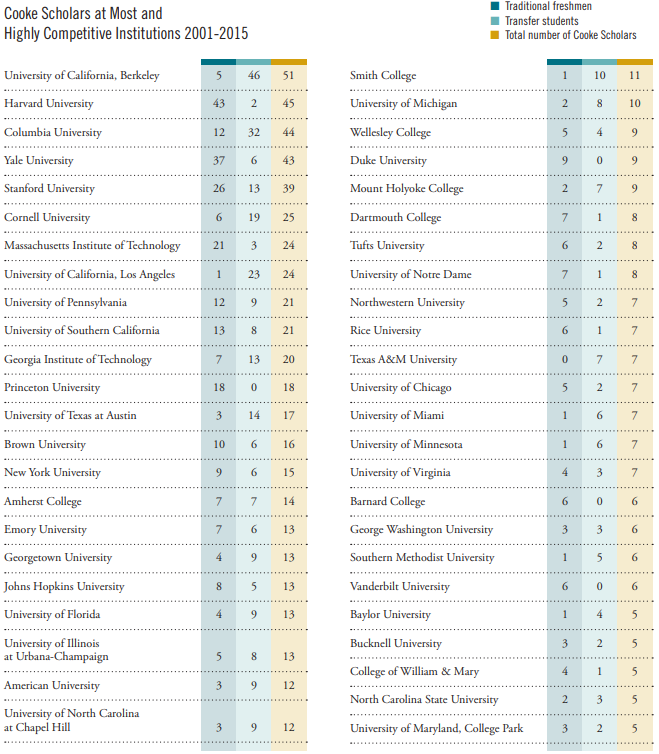
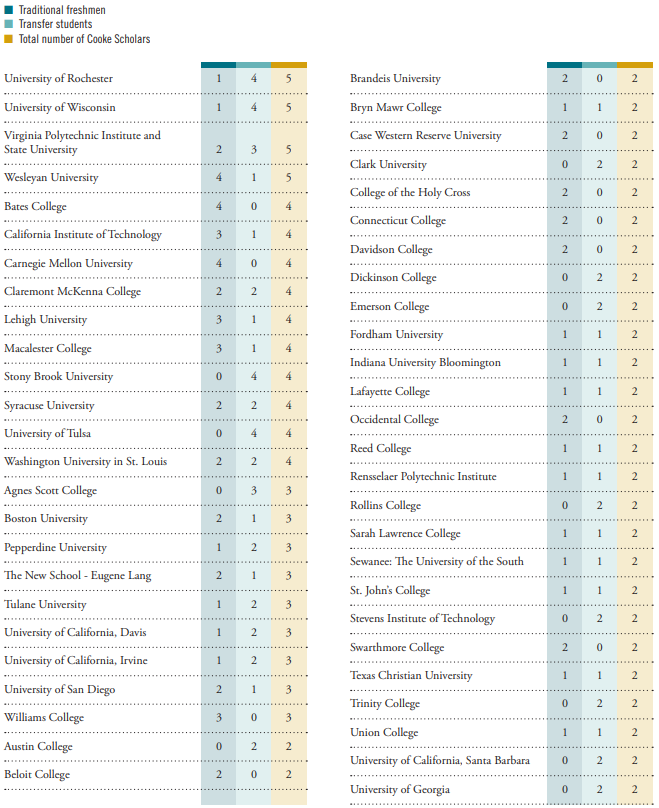
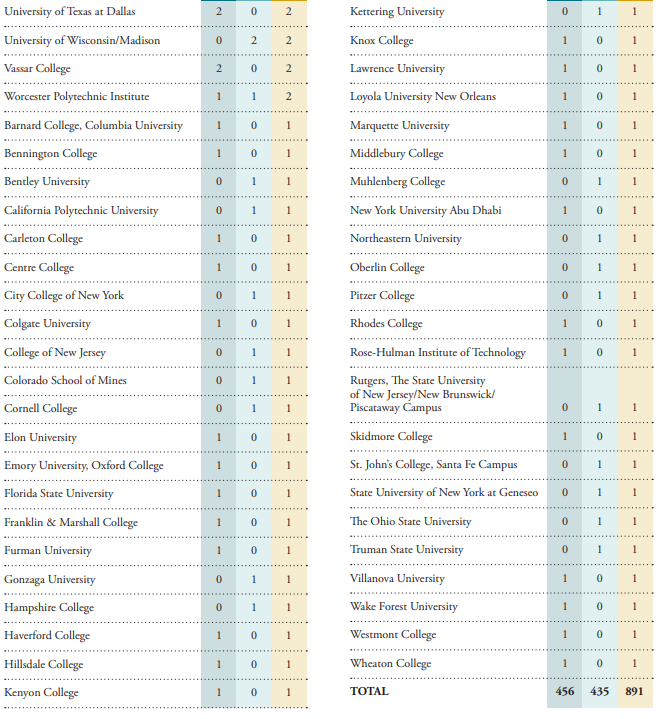
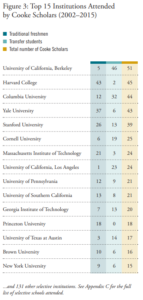
The experience of the Jack Kent Cooke Foundation in finding such students is directly on point. Since 2002, the Cooke Foundation has funded the education of 891 undergraduate students who attended either a most or highly competitive institution. In recent years, these students’ combined math and critical reading SAT scores ranged from 1170 to 1600. Of those who entered as freshman from high school, 95 percent graduated, earning a cumulative grade point average (GPA) of 3.5. The graduation rate of those who entered as transfer students from community college was even higher—97 percent—with a final average cumulative GPA of 3.6. Collectively these students, who have enrolled at 146 selective institutions (Figure 3), represent the best and brightest students from families with financial need, and demonstrate how successful more high-achieving, low-income students could be with more systematic support.
Cooke Scholars
exemplify success:95% of Cooke College
Scholars graduate,
earning an average
GPA of 3.5.97% of Cooke Transfer
Scholars graduate,
earning an average
GPA of 3.6.
Cooke Scholars represent only a fraction of the potential talent pool. In 2015, the Cooke Foundation received more than 3,300 applications from lower-income high school seniors whose SAT/ ACT scores were in the top 15 percent; if past enrollment patterns are any guide, at most only one in three of these applicants will ultimately attend a highly selective college or university. Researchers have estimated there are between 25,000 and 35,000 students who score in the top decile on the SAT or ACT and come from families in the bottom income quartile.9 Comparing these figures to enrollment data from COFHE schools, researchers estimate that highly selective schools could increase the representation of low-income students by 30 percent without compromising SAT or ACT standards and with increased social diversity.10
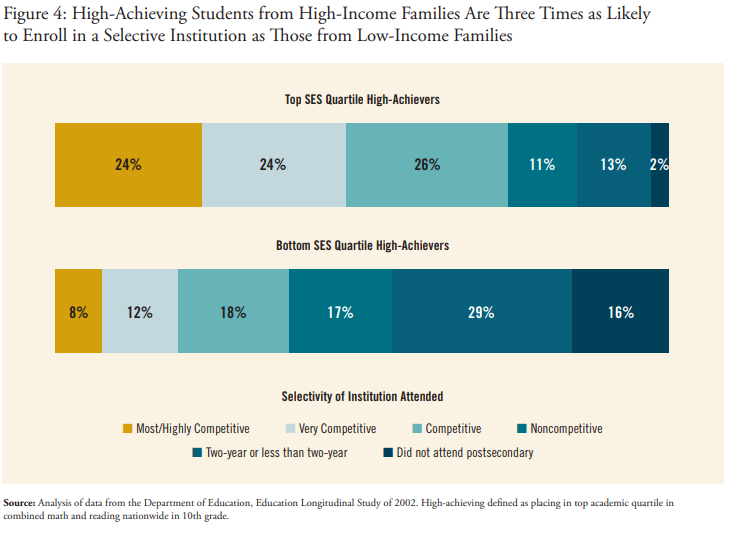
Our research confirms what study after study has demonstrated: the vast majority of high-achieving students from economically disadvantaged households do not enroll in selective colleges or universities (Figure 4).11 Indeed, the likelihood that a top student from a low-income family will find his or her way to a selective college is remote. Using the Education Longitudinal Study of 2002, we found that high-achieving students from the wealthiest families were three times as likely to enroll in a highly selective college as those from the poorest families (24 versus 8 percent). Other researchers have demonstrated that this trend holds true even among the most talented low-income students who score in the top ten percent nationwide on the SAT or ACT.12
The underrepresentation of
high-achieving, low-income students at
the nation’s selective institutions stems
from two factors: low-income students
are less likely to apply to selective schools,
and low-income students who do apply
receive inadequate consideration in the
admissions and financial aid process.
This underrepresentation of high-achieving, low-income students at the nation’s selective colleges stems from two factors: 1) low-income students are less likely to apply to selective schools, and 2) low-income students who do apply receive inadequate consideration in the admissions and financial aid process. The importance of attending a selective institution is described briefly in the following two pages, after which we discuss these two contributing factors in Parts 2 and 3 of this report.
Institutional Selectivity Matters
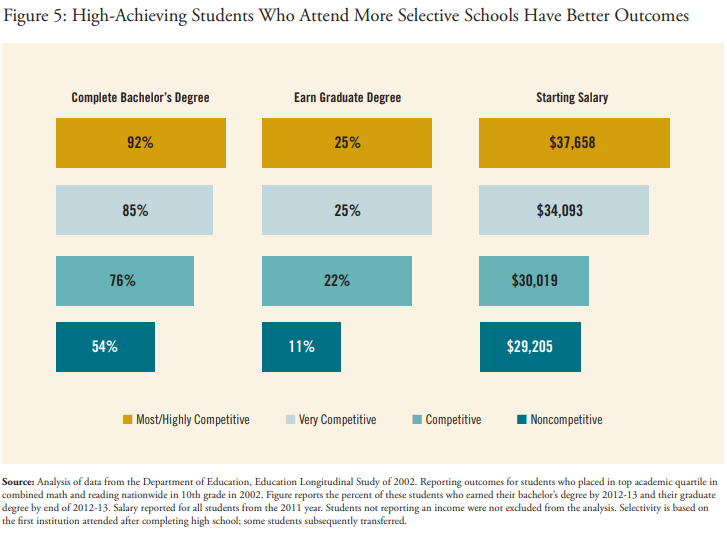
Commentators sometimes contend that the selectivity of one’s college matters less than individual determination or ability.13 However, our analysis is unequivocal: high-achieving students who attend more selective schools graduate at higher rates, earn higher incomes, and are more likely to pursue a graduate degree (Figure 5). This remains true even after controlling for student’s academic ability.14 In other words, where you go to school matters.
This relationship is especially true for low-income students, who benefit from the increased retention supports—in particular specialized counseling services—selective institutions often provide.
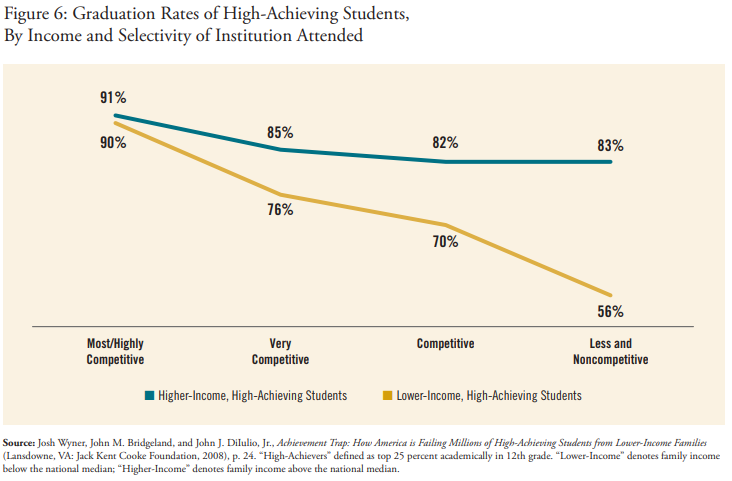
In fact, an earlier analysis by the Jack Kent Cooke Foundation shows that only at the most selective schools do high-achieving, lower-income students graduate at rates equal to students from higher income backgrounds (Figure 6).
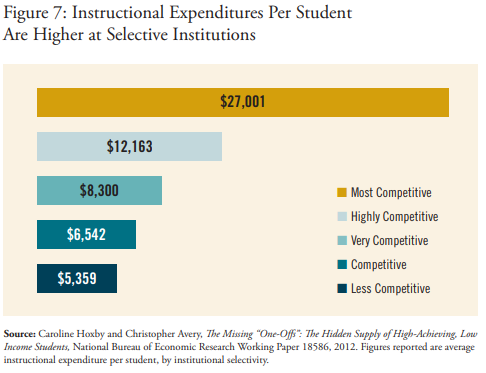
Our review of findings from other researchers aligns with our conclusions. It suggests that students also receive a higher quality education at selective colleges, at least as measured by per pupil spending (Figure 7). They are taught by some of the world’s most distinguished teachers, as evidenced, for example, by the high number of Nobel Laureate prize winners who have taught at selective colleges and universities.15
Top employers typically recruit from selective colleges and universities.16 And, selective institutions cultivate our nation’s leadership: 49 percent of corporate industry leaders and 50 percent of government leaders graduated from only 12 selective colleges and universities.17 If we want a nation where at least some of our leaders know first-hand what it is like to grow up poor, then the doors of selective institutions must be open to students from all communities. Low-income students depend on higher education as a route to social mobility, but college will never be the great equalizer if the brightest of the poor cannot even get in the door.
The vast majority of
high-achieving students
from low-income
households do not enroll
in selective colleges or
universities, but those
who do receive a
more resourced education
and are more likely
to graduate.
Under-Matching
The Persistent Problem of Under-Matching
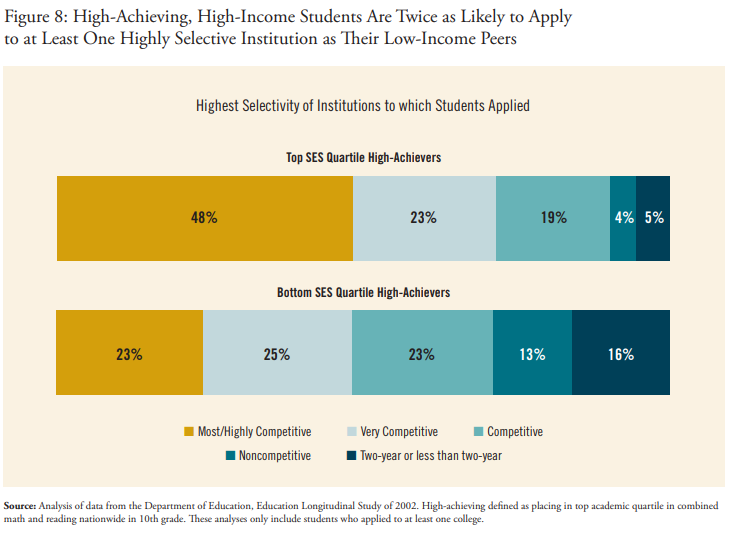
Thousands of low-income students every year graduate from high school with high grades, high test scores, and strong academic motivation but do not apply to selective colleges and universities. Our research shows that only 23 percent of high-achieving, low-income students apply to a selective school, compared with 48 percent of high-achieving, high-income students (Figure 8). Termed “under-matching” by researchers, many high-achieving, low-income students choose not to apply to schools whose student bodies have high levels of academic ability on par with their own, and instead apply to schools where the average student’s academic capacity is lower than their own.18
The Jack Kent Cooke Foundation has seen this pattern among applicants for its scholarships. Since 2002, the Cooke Foundation has supported high-achieving students from low- to moderate income backgrounds through college scholarships for high school seniors and community college transfer students. The eligibility criteria for a Cooke Scholarship are rigorous: students must have an un-weighted cumulative GPA of 3.5 or higher, and high school seniors must also have scored in the top 15 percent on the SAT or ACT. Yet even within this self-selected group of motivated, talented students, 38 percent do not list a Most or Highly Competitive institution among their top three college choices when they apply.19
Why Don’t More High-Achieving, Low-Income Students Apply to Selective Schools?
William R. Fitzsimmons, dean of admissions and financial aid at Harvard College for over two decades, has said, “Our goal in admissions is to attract the best students to the college.”20 However, for the most part, only the best students from higher income families end up applying to selective institutions such as Harvard, not the best from all income brackets. In particular, students from the bottom income quartile comprise only 11.7 percent of applicants and 9.1 percent of admitted students at the nation’s most selective institutions.21 Put another way, “for every high-achieving, low-income student who applies [to selective institutions] there are from 8 to 15 high-achieving, high-income students who apply.”22 Researchers examining under-matching have identified two primary reasons why high-achieving, low-income students do not apply to selective schools.
1. They don’t think they can afford it.
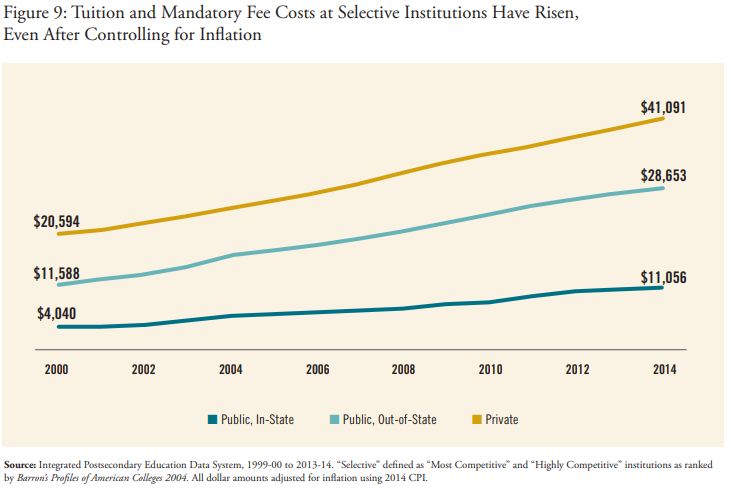
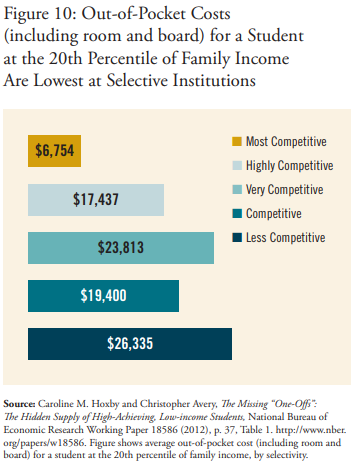
While the cost of higher education has been rising for decades, the stated tuition and fees at elite colleges (especially private institutions) have skyrocketed, even after adjusting for inflation (Figure 9). Low-income families, seeing these “sticker prices,” often fail to understand that with financial aid, attending a selective school might actually cost them less than their local public university (Figure 10). Indeed, one study found that at one selective school, students with family income less than $24,000 paid less than $1,000 per year despite the institution’s stated price of $33,831.23
Our analysis of applications submitted through the Common Application organization (“Common App”) finds that 84 percent of high-achieving students with family incomes below $20,000 fail to obtain the Common App fee waiver for their college applications, despite clearly being eligible for one.24 This finding suggests that it is often a lack of knowledge about how college financial aid works that stands in the way of students applying, not students’ actual desires or financial circumstances.
Stories abound of high-achieving, low-income students who are unaware of how much financial aid they might be eligible to receive from a selective institution. One author tells of Karen, a high-school valedictorian from a low-income family who received a perfect score on the verbal SAT, and who aspired to attend an Ivy League institution. Karen’s parents, who had not themselves attended college, questioned the value of attending an out-of-state private institution and told Karen they could not afford the tuition (not understanding the amount of financial aid they would receive). In the end, Karen matriculated at a small school that was close to home, finding out only later that spring that it would have been free to attend the Ivy institution of her dreams.25
Some scholars question whether this lack of information is exacerbated by intentional actions on the part of the institutions themselves. For example, researchers examining the webpages of selective institutions offering no-loan financial aid packages found it exceedingly difficult to locate clear information about the policies. Observing that financial aid policies are more clearly communicated to the higher education community (via avenues such as the Chronicle of Higher Education) than to students and families themselves, the researchers questioned whether the institutions deliberately obfuscate information about their financial aid offerings so as to limit the number of low-income students who apply while still receiving credit for their “social justice efforts.”26 If true, this challenges the purpose of “need blind” enrollment policies; it suggests these need-friendly policies are just a form of public relations.
If selective colleges and universities were to address these issues, there would be a dramatic shift in student behavior on the part of low-income, high-performers. Research is clear that changing high-achieving, low-income students’ understanding of how college financial aid works can dramatically increase the number of applications they submit to selective schools. By sending students an inexpensive mailing costing $6, researchers were able to increase the percent of high-achieving, low-income students who applied and were admitted to a match institution by 31 percent.27 Other studies have found that simply sending semi-customized text messages to students’ cell phones can increase their completion of the Free Application for Federal Student Aid (FAFSA), a necessary precursor to obtaining a federal Pell grant.28 This is a critical first step as our research suggests that only 71 percent of high-achieving, low-income students complete the FAFSA.29 The failure of more than a quarter of high-achieving, low-income students even to apply for federal financial aid—which provides a straight tuition subsidy for the lowest income students—suggests that there is far more confusion about the true cost of higher education than is generally understood.
2.They don’t receive accurate, individualized guidance.
Even when students understand how financial aid works, they may not believe they “belong” in a selective school. Many high-achieving, low-income students do not know anyone in their social network who has attended a top institution.30 One study found that only 36 percent of low-SES high school valedictorians felt it was important to attend a “prestigious college,” compared with 50 percent of high-SES valedictorians.31 Sometimes these misguided beliefs are unwittingly fueled by well-meaning high school counselors. A 2008 Cooke Scholar, Abigail M., has described what it was like applying to colleges and universities from her small, rural high school in Nebraska:
“There were only 57 students in my graduating class. Most of us went to college, with a few opting for trade schools, jobs, or the military. Those who chose to attend four-year colleges all went to the University of Nebraska or nearby state schools. My high school emphasized the importance of applying to college, so everyone in my senior class was required to fill out an application to the University of Nebraska. That being said, my classmates didn’t seem to be aware that attending, or applying to, a private university was an option. When I expressed interest in attending one, my counselor was eager to help, but having had only a couple of students over the years attend private colleges and universities, she lacked knowledge about the opportunities and requirements. She was unfamiliar with the Common Application. One other boy in my class was interested in applying to a school using the Common App system, so my counselor asked me if I would be willing to sit down and show him how, after I figured it out.”
Research is clear
that changing
high-achieving, lowincome
students’
understanding of how
college financial aid
works can dramatically
increase the number of
applications they submit
to selective schools.
There are numerous efforts underway to address counseling needs. The Cooke Foundation sponsored the College Advising Corps to train recent graduates to provide counseling. From 2005 to 2014 the College Advising Corps served over 500,000 students.32 In Chicago, the school district added college counseling in low-income schools and it resulted in significantly increased college enrollment.33 The Coalition for Access, Affordability, and Success—made up of more than 80 selective institutions—recently created a digital tool to make the application process more accessible to low-income students. The Common App organization has created a comprehensive training resource with ready-to-present slide decks, accompanying scripts, and complementary video tutorials.34 Similarly, the ECMC Foundation has sponsored Pell Abacus, a net price calculator for Pell-eligible students that provides approximations of actual college costs. Yet 40 selective colleges and universities currently block Pell Abacus.35 To be successful, these new systems will actually need to reach large numbers of low-income students who lack adequate guidance and technological support, and be welcomed by colleges and universities. Colleges and universities themselves have an important role to play here.
Admission Process
Selective Institutions’ Admissions Processes Disadvantage Low-Income Students
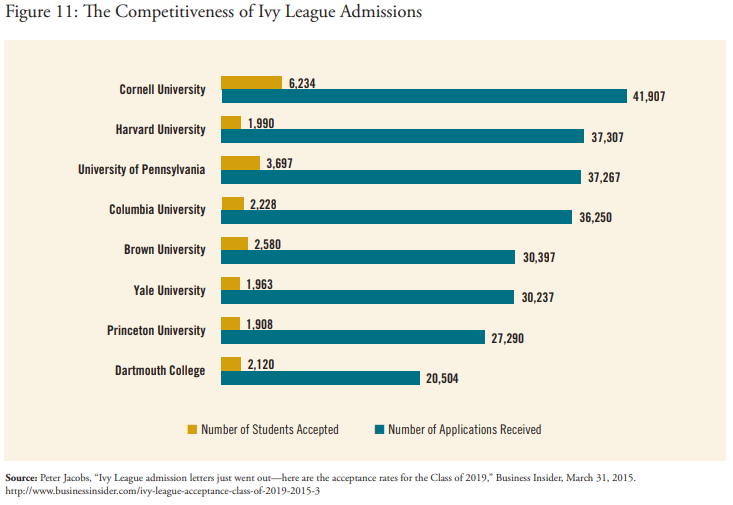
While student behaviors certainly contribute to enrollment inequalities, so do the admissions practices at selective colleges and universities themselves. As demand for higher education and the number of institutions to which students apply have both grown, competition for seats in the nation’s more selective institutions has skyrocketed, leaving admissions officers with the daunting task of choosing the most meritorious from an excess of highly qualified candidates (Figure 11).36 Unfortunately, the processes they use are unfair to high-achieving, low-income students at every turn.
Academic Assessment
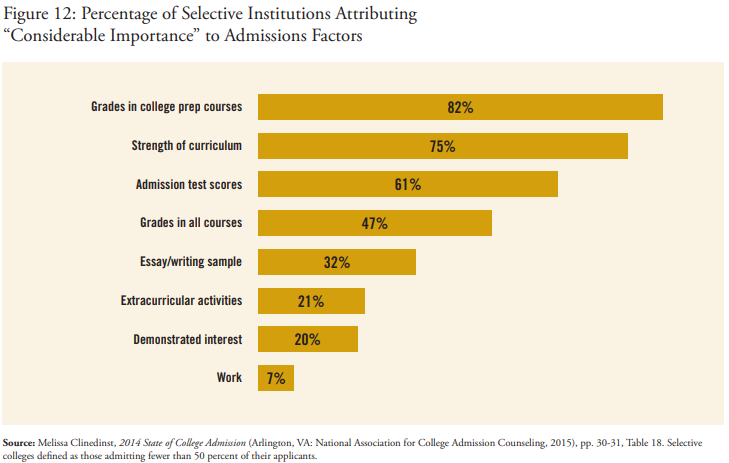
Selective institutions seek to admit students with demonstrated high levels of academic talent who will succeed in rigorous and demanding academic programs. On its website, for example, Princeton University calls for admitting “a varied mix of high-achieving, intellectually gifted students.”37 A recent study where admissions officers of highly selective institutions were polled found that they cited grades, strength of curriculum, and admission test scores as the three most important factors in their admissions processes (Figure 12). Although neutral on its face, the admissions process as it is implemented is actually skewed dramatically against the poor.
With tens of thousands of applications to review (in 2014, for example, Yale received over 30,000 applications for 1,360 spots38) admissions officers must rely to some extent on quantitative measures of students’ abilities. And with some estimating that 70 percent of the applications received by selective institutions are worthy of consideration, admissions officers rely on an initial “Academic Index” score to reduce the applicant pool.39 This primarily quantitative review relies on SAT and ACT scores, GPAs (weighted and un-weighted), and metrics of curriculum rigor (advanced courses taken, etc.) to rank applicants. According to a 2014 study, 76 percent of the nation’s most selective institutions apply an initial academic review to all applications to weed out applicants who are not capable “of doing the work.”40 Applicants not making the initial cut are excluded from further review, and their applications are never read. Several aspects of this process indirectly reduce the chances of admission of high-achieving, low-income students.
Most importantly, high-achieving, low-income students are less likely to have access to college level coursework than other students. This is one of the key factors in constructing most Academic Indexes. Low-income students are one third as likely to take Advanced Placement or International Baccalaureate (AP/IB) courses as other students. This is partially a function of attending rural and small schools, which are less likely to offer AP/IB programs, and partially a function of being steered away from higher level courses even when AP/IB programs are offered.41 The failure to take AP/IB courses means that a significant percentage of low-income students who could perform well in highly selective colleges will never even be considered because they have a low Academic Index score.
Related to this, students taking advanced courses in high school often receive a weighted grade—i.e., the addition of a predetermined numerical value to their course grade when calculating their GPA. This over-weighting is intended to account for the greater difficulty of the material, however, use of weighted GPAs in admission reviews puts low-income students at a disadvantage; with fewer AP/IB courses available to them, their GPA is capped at the standard maximum (typically 4.0), whereas students with greater access to advanced coursework have the potential of reporting higher cumulative GPAs. In some schools, it is routine for students taking AP/IB courses to report a “weighted GPA” of up to 5.0.42
The overreliance on standardized tests is also concerning, especially given that institutional reliance on SAT and ACT test scores has risen.43 In 2007, 48 percent of admissions officers at selective colleges reported placing “considerable importance” on SAT/ACT scores, while by 2014 that figure had risen to 59 percent.44 No doubt this change is driven in part by the need to limit the number of applications that are read, and by the weight placed on average test scores by competitive college ranking regimes. In the U.S. News & World Report’s “Best Rankings,” SAT/ACT scores comprise 65 percent of the “student selectivity” score used in the magazine’s rankings (up from 50 percent in 2010).45 Small differences in average test scores can increase an institution’s ranking, leading to greater prestige, larger numbers of applicants, and a higher “yield rate” (the percent of admitted students who enroll).46
This rising emphasis in college admissions on SAT and ACT scores is problematic, because the initial quantitative screening likely removes a disproportionate number of low-income students from further consideration. The research does not justify such weight being placed on incremental test scores as it is entirely unclear whether small differences in standardized test scores are indicative of a difference in students’ ability to complete rigorous academic work and (most importantly) to graduate from selective institutions. One study found that within selective institutions, while students with a combined (math and critical reading) SAT score below 1000 had lower graduation rates, there was only a small difference in graduation rates between students with scores between 1000 and 1200, on the one hand, and those with scores above 1200, on the other (86 versus 96 percent, respectively).47 Another study found that SAT scores cannot, with any accuracy, predict which students will earn a high GPA (over 3.75).48
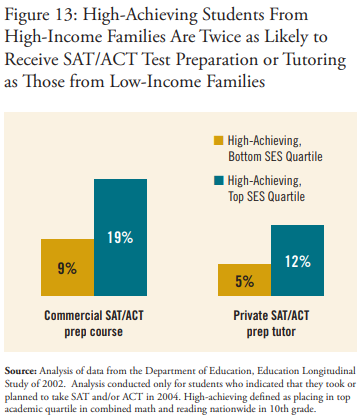
While high test scores are indicative of advanced academic ability, somewhat lower scores do not always indicate lack of advanced ability. This is classically a “false negative,” a score that suggests lack of ability in a student who is actually quite capable. Particularly with respect to high-achieving, low-income students, a marginally lower test score may well be the result of a lack of coaching or the lack of resources that would enable the student to take the SAT or ACT tests multiple times. Our analysis of the Education Longitudinal Study data confirms that high-achieving students from the wealthiest families are twice as likely to have taken SAT preparatory courses or tutoring as those from the poorest families (Figure 13). It is in response to these discrepancies that the College Board recently partnered with Khan Academy to offer free, online SAT preparation, which is no doubt helpful, but cannot completely replace in-person instruction.
While the conventional wisdom is that test coaching only has a marginal effect—perhaps 30 points out of 1600 on the SAT reading and math tests—for years Princeton Review claimed an average gain of 255 points for students who took its SAT “ultimate classroom course.”49 Numerous studies support the proposition that coaching programs aid achievement test performance. At least one study has suggested that test coaching is particularly effective for high SES students.50 If a difference in test results excludes a low-income student from further consideration—even if the difference itself is small—then the seemingly marginal advantage becomes very significant, perhaps dispositive of a student’s chances for admission.
The father of the SAT, Harvard’s President James Bryant Conant, in the 1930s said he preferred relying on the aptitude test in preference to an achievement test because he feared that the latter could be the subject of coaching. “[T]hey favored rich boys whose parents could buy them top-flight high school instruction.”51 It is telling that 85 years later we are still worrying about the fairness of the test with respect to the low-income (or at least not wealthy) student.
The growing movement for colleges and universities to become “test-optional,” removing the SAT/ACT test score requirement, is seen by many as an effort to reduce emphasis on standardized tests that might disadvantage low-income or minority students. Unfortunately, research shows that test-optional policies have had little effect on low-income and minority student enrollment, though they have resulted in increased institutional prestige via higher college rankings, the result of having SAT/ACT scores reported only by students with higher scores.52
Demonstrated Interest
Seemingly innocent practices that have an unforeseen but clearly detrimental impact on the chances of high-achieving, low-income students abound. Some admissions offices give preference to students who demonstrate strong interest in the college by visiting the campus in person, for example. In fact, at one in five selective institutions “demonstrated interest” receives “considerable importance” in the admissions decision.53 Driving this preference is the institutional desire to offer admission to students who are more likely to accept, thus increasing the institution’s “yield rate,” the percentage of applicants granted admission who actually enroll. Such emphasis, unfortunately, penalizes low-income students, whose family financial constraints and parents’ work schedules often preclude them from making campus visits. We are unaware of any institutions that, recognizing this unfairness, attempt to offset this penalty by only attributing value to demonstrated interest for students who have the means to visit.
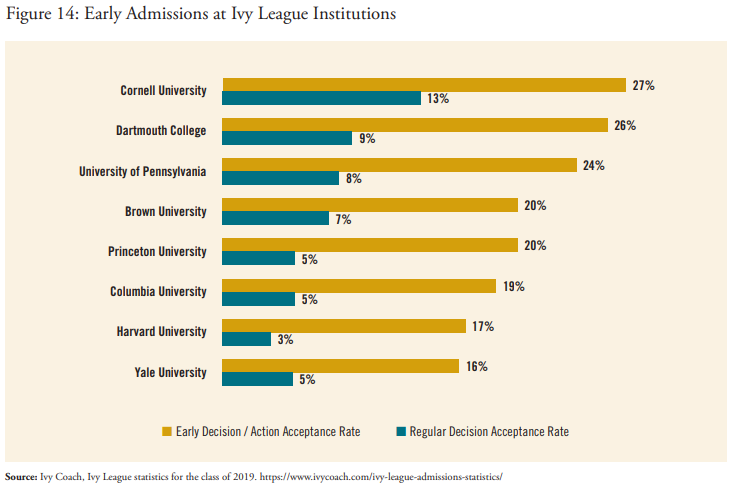
Institutions also reward students who submit their application early. Under one variant, “early action,” students may still apply to other schools, while under another, “early decision,” students must commit to attend if awarded admission. Institutions uniformly admit early admissions applicants at higher rates than other applicants. In the Ivy League, for example, early admissions applicants are admitted at rates three to five times higher than other applicants (Figure 14).
One study estimates that students applying early admission receive the equivalent of a 100 point bonus on the SAT.54 Yet low-income students are often unaware of the advantages of applying early and, in any event, are not generally in a position to apply using the binding early decision process. Offers of early decision come before students receive their acceptance and financial aid packages from other institutions to which they applied, but if accepted, students who apply early decision must attend that school. This practice puts low-income students at a disadvantage because they are unable to commit to an institution before they have received their financial aid packages from all the schools to which they are accepted.
Our analysis of Common App data confirms the hypothesis that low-income students are disadvantaged by the early decision process: 29 percent of high-achieving students from families making more than $250,000 a year applied early decision, compared with only 16 percent of high-achieving students from families with incomes less than $50,000.55 In short, low-income students are half as likely to apply early, even though doing so would dramatically increase their likelihood of admission; this remains true even when applying to institutions that practice so-called “need-blind” admissions, i.e., the practice of separating the admissions function entirely from financial aid. (Of course, making admissions decisions without respect to considering a student’s family income can have the perverse effect of working against the low-income student who has overcome seemingly insuperable barriers and yet emerged with a strong academic record. Much depends on the actual administration of the policy.)
Recognizing the unfairness of the early admissions practice for low-income students, in 2006 Harvard College, Princeton University, and the University of Virginia eliminated early admissions from their processes entirely. When no other selective institutions followed suit, all three institutions reinstated the practice within five years.56 As a consequence, the unfairness continues.
Being “Hooked”: Non-Academic Preferences That Disadvantage Low-Income Students
The admissions process contains far more insidious advantages for the high-income applicant. Even when high-achieving, low-income students apply with extraordinarily strong grades, high test scores, a well-constructed application, and have managed to visit campus despite the cost, their application might still fall short of others due to the well-documented practice through which certain applicants receive a boost in the review process for non-academic factors. These factors—which have nothing to do with a student’s academic strengths—include the applicant’s athletic ability, being an underrepresented minority, having a parent or relative who previously attended the institution, or having sufficient means to afford to pay full tuition. Admissions officers describe such students as being “hooked,” and the preference for these extraneous factors rarely benefits high-achieving, low-income students.
Athletic Preference
While many selective institutions state that they do not offer athletic scholarships (only need-based aid), admissions officers readily admit to offering preferential review and reserved spaces for recruited athletes.57 The New York Times reports that at Amherst College, for example, 75 of the 450 incoming freshman spaces are reserved for recruited athletes identified by coaches, quoting the admissions dean as saying, “athletic recruiting is the biggest form of affirmative action in American higher education, even at schools such as ours.”58 Many of these slots go not to minority or low-income students, however, but to wealthy, suburban, White students who play sports such as squash, sailing, crew, and water polo.59 Students with strong athletic ability are often admitted despite having weaker academic credentials than other students, with one analysis of 90,000 students at selective colleges and universities estimating that recruited athletes are as much as four times as likely to be admitted as other similarly qualified applicants. The athletic preference is particularly objectionable because, once admitted, these athletes under-perform academically, earning lower college grades than their high school grades and SAT/ACT scores would have predicted.60 Moreover, the popular notion that recruited athletes tend to come from minority and indigent families turns out to be just false; at least among the highly selective institutions, the vast bulk of recruited athletes are in sports that are rarely available to low-income, particularly urban, applicants.
Affirmative Action: Racial Preference
Race-conscious affirmative action has been used for decades to address past inequities and offer students from disadvantaged minority groups (particularly African Americans and Latinos) a better chance at gaining access to college. As a result, in selective colleges and universities today, underrepresented minorities receive a 28 percentage point boost in admissions compared to White students with the same credentials.61 Low-income students who are not minorities receive no such advantage. This preferential treatment is intended to benefit minority students who may have suffered from historical prejudice, inequity, or outright discrimination.
The preference is also intended to benefit institutions because racial and ethnic diversity has been shown to contribute to enriched learning environments by exposing students to students and faculty who come from diverse backgrounds.62 Selective institutions are particularly attuned to the value of diversity, many having only recently cast off histories of racial, religious, and ethnic exclusion. Harvard College, for example, today states on its admissions webpage, “We believe that a diversity of backgrounds…among students who live and learn together affects the quality of education in the same manner as a great faculty or material resources.” Even the Supreme Court has noted that “the nation’s future depends upon leaders trained through wide exposure to the ideas and mores of students as diverse as this Nation of many peoples,” although the policy of affirmative action in college admissions, as already noted, is actively under review.63
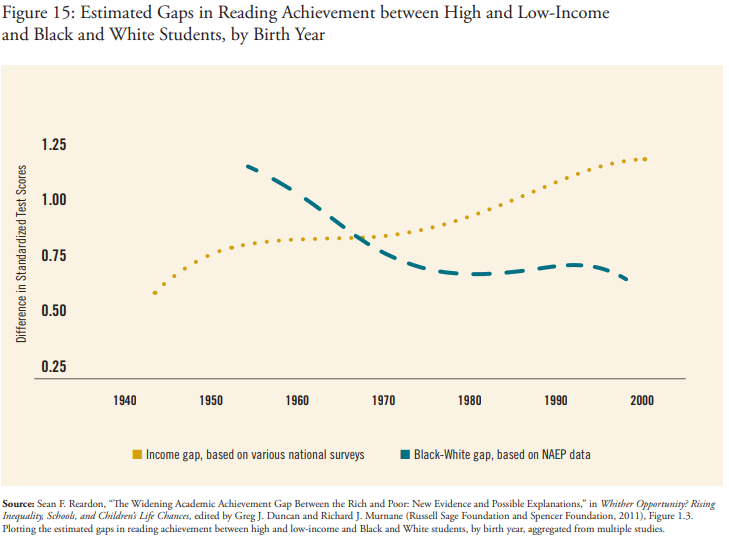
In the context of higher education admissions, “diversity” often translates to mean racial and ethnic diversity. And yet, while racial discrimination remains an important problem in American society, today economic status has actually eclipsed race as the primary source of academic disadvantage. The Black/White test score gap was once twice as large as the gap between low-income and high-income students, but today precisely the reverse is true: the income gap is twice as large as the race gap, and growing (Figure 15).64
As more minority families successfully break through segregated glass ceilings and establish themselves in the middle and upper classes, it is increasingly their children who gain admittance to selective institutions, not the children of minorities living in impoverished, underprivileged neighborhoods. Indeed, 86 percent of Black students at selective colleges are middle or upper-class.65 This was far from the original intention of race-conscious affirmative action in college admissions.
Financial Aid to Students Who Can Pay Their Own Way: the Mediocre Student Preference
Some institutions indirectly discriminate against students who cannot pay the cost of college (tuition, fees, room and board) by providing non-need-based merit scholarships to higher-paying, lowerability students. Only about 100 institutions (out of approximately 4,200 nationally) are “need-blind,” meaning that they do not take into consideration at all a student’s ability to pay.66 In other words, the vast majority of colleges and universities do consider income when reviewing applications, and this sometimes results in the shifting of scarce financial aid resources away from those most in need to non-need “merit aid” programs.67
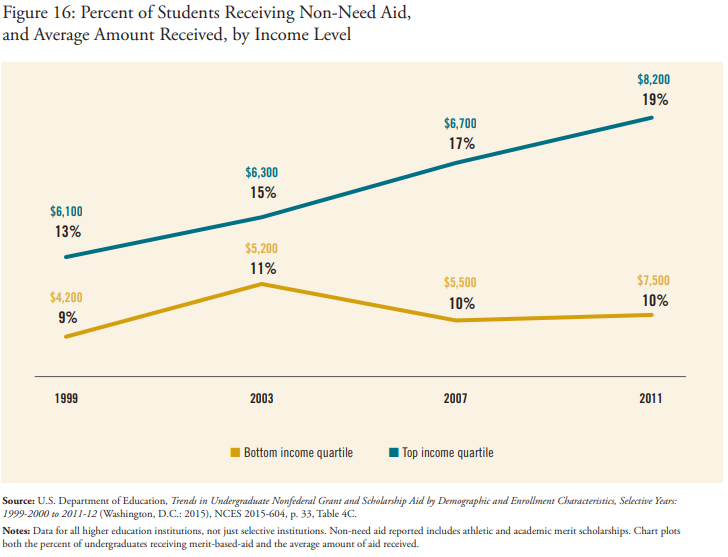
At the same time, the absolute dollars available to students with financial need has been reduced. S. Georgia Nugent, former president of Kenyon College, notes that “financial aid available to the lowest-income students has plummeted, and financial aid to the highest has soared.”68 Data from the U.S. Department of Education confirms this trend. Nationwide, the percent of undergraduates receiving non-need-based institutional aid (for athletics or “academic merit” scholarships) has actually risen for wealthy students in the top income quartile, but not for those in the bottom income quartile (Figure 16). It is an embarrassment of the first order, defensible only insofar as the tuition payments are necessary to balance academic budgets. Even then, in essence, colleges are making the mercantile decision to live off the backs of less talented students while sacrificing the more talented poor.
Legacy Preference
Perhaps the preference that is the most antithetical to the principle of true merit selection is the “legacy preference.” Under legacy admissions, institutions give admissions preference to children of alumni.69 In some elite institutions, legacy applicants are automatically advanced to the second round of admissions.70 The practice is doubly unfair, because legacies are disproportionately wealthy, otherwise privileged, and White, so the preference constitutes in essence affirmative action for the rich.71
Yet the use of the legacy preference is widespread at elite colleges and universities. Over 80 percent of our most selective institutions employ legacy preferences.72 Although schools often claim that preferences for the offspring of alumni are just a “tiebreaker” among roughly equal candidates, research suggests legacies receive the equivalent of a 160 point boost on the SAT (out of 1600 points).73 Harvard’s legacy admit rate is 30 percent—four times the admit rate of regular applicants.74
The best argument in favor of the legacy preferences is that it encourages greater charitable giving to the college or university by its alumni. However, researchers have found no evidence that this is true.75 It has also been suggested that abandoning the legacy preference would ultimately make little difference in actual admissions, because most legacy applicants—having benefited from the generous academic supports that wealthier students receive— would likely be admitted anyway for their own merit. If that’s true, then the existence of the preference should not matter.
Why, in a country where we fought a war of independence to get away from inherited aristocracy, do so many of our leading universities employ preferences based on lineage? The very existence of the preference allows donors to buy their children’s way into selective schools. It is as though competitive academic placement applies only to the poor, while admissions among the wealthy is open to the highest bidder.
The Deck is Stacked Against High-Achieving, Low-Income Students
By the time all of the admissions preferences and processes (such as early decision and demonstrated interest) are added up, there is little room left for high-achieving, low-income students, nor do these students receive any preferential treatment of their own for having overcome the often steep barriers that result from growing up in poverty. In fact, analysis of 13 selective institutions’ admissions data suggests that while being an athlete, underrepresented minority, or legacy provides considerable advantage in college and university admissions, emerging from low-income families and being a top student provides no boost whatsoever (Figure 17).
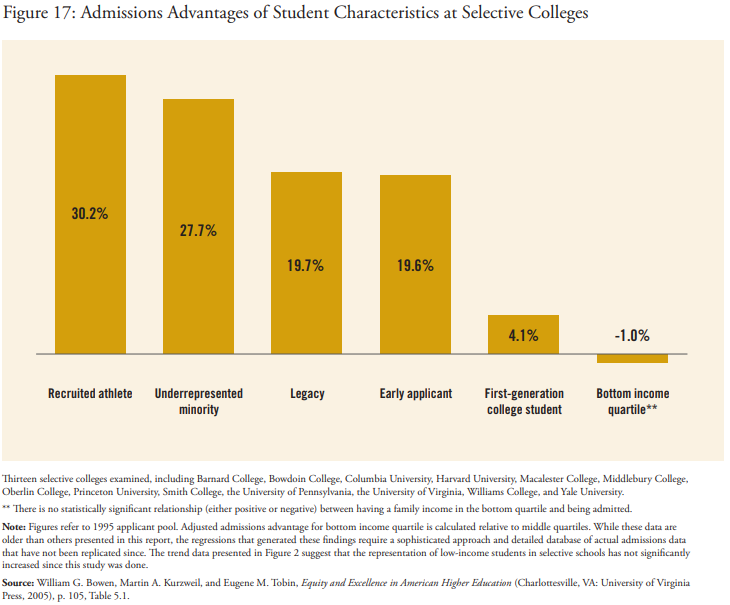
We conclude that the preferences and some admissions processes in selective colleges and universities, taken together, have resulted in a surprising, and probably inadvertent, result:
Being admitted to a selective institution is actually harder for the high-achieving, low-income student than for others.
Many selective colleges and universities would dispute this conclusion. They would claim that they already provide a boost for economically disadvantaged students because their admissions process recognizes that merit should consider not just a student’s endpoint but the distance traveled from low-income high school to elite college or university.76 But what institutions say is very different than what they do, and when the data are examined, multiple researchers have found that being in the bottom income quartile (relative to the middle quartiles) has no positive effect on admissions.77
In fact, being low-income may actually constitute a disadvantage in admissions. While the nature of the data does not yet provide a firm statistical basis to draw such a conclusion, anecdotal evidence is rife. When all these admissions preferences are summed up, the number of unhooked application slots is profoundly limited; estimated by one university chancellor as comprising only 40 percent of the available seats at Ivy League institutions.78 In the words of another college official, to be accepted at an elite institution an unhooked candidate “has to walk on water.”79
The Solution
Increasing Access for High-Achieving, Low-Income Students
A 1200 SAT score and 3.5 GPA means something very different for a student who grew up in a low-income single-parent household and attended substandard schools than a wealthy prep school graduate who was “shot out of a cannon,” in the words of Amherst admissions officer Tom Parker.80 Current admissions practices fail to acknowledge this difference. In fact, as discussed, they actually punish the striver.
Our current system of admissions is difficult to justify. Public colleges and universities receive taxpayer support because they are supposed to benefit the public at large. Likewise, private, non-profit colleges and universities receive favorable tax treatment because they are supposed to serve the broader public interest. (At the upper-end of the spectrum, for example, Princeton University is estimated to receive the equivalent of $105,000 per pupil in public support annually through preferential tax treatment and other subsidies.)81
Given their charge of advancing the public interest, colleges and universities should strive for admissions systems that honor true academic merit and seek to identify those students who have the best scholastic records, are otherwise most deserving, and most likely to contribute to society. Admission based on true merit rather than an incidental status for which they have no responsibility or which has nothing to do with their academic abilities would consider traditional indicators of excellence (such as grades, test scores, and leadership skills) and, in projecting future contributions to society, would also consider the obstacles that students have overcome.
We do not disparage the argument that admissions officers must “build a class” such that it contains a diverse group, including athletes, legacies, minorities, student government leaders, artists, musicians, poets, as well as pure scholars. However, we believe the pendulum has swung too far. At base, colleges and universities are academic institutions, not social clubs.
Poverty Preference: A Necessary Corrective
To address the problem that students with severe financial need are being overlooked by the existing admissions process, selective colleges should institute a preference for students who are low-income. There are three reasons that this remedy should be adopted. First, it recognizes that students who are otherwise competitive and have overcome poverty’s burdens have demonstrated a persistence and tenacity that is worthy of recognition and is likely to distinguish them in later life. Second, it offsets the myriad of preferences and processes outlined in this report that have the cumulative effect of unfairly handicapping such students. Third, it provides a viable alternative strategy to promote racial diversity on campus, particularly if the Supreme Court precludes or limits race-conscious affirmative action in the currently pending Fisher II Case.
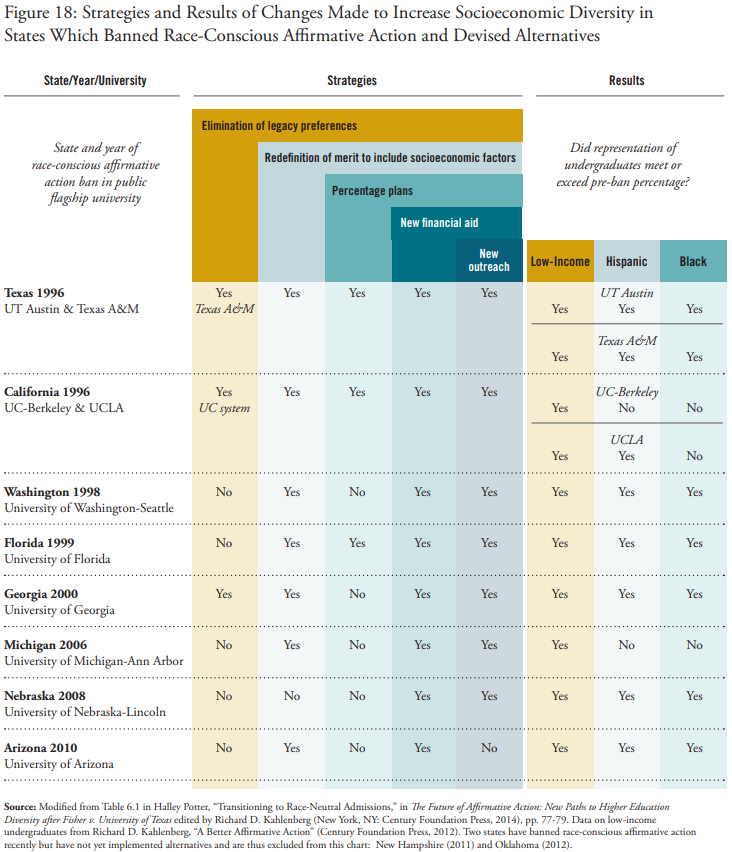
A handful of institutions have already instituted policies that de facto or de jure constitute a poverty or low-income preference. In the ten states where racial affirmative action programs have been banned at public universities (by voter referendum, executive order, or legislature action), a number of innovative strategies have been adopted to open up opportunities for economically disadvantaged students including:
- removing preferences for the wealthy,
- broadening merit definitions and assessment processes to better identify high-achieving students from varied socioeconomic backgrounds,
- expanding outreach strategies, and
- increasing financial aid. Figure 18 outlines how states used these strategies and their results. Each strategy is then discussed in more detail on pages 31–33.
Removing Preferences for the Wealthy
Public flagship universities in Texas, California, and Georgia have dropped legacy preferences entirely. At the University of Georgia, for example, administrators decided to eliminate the use of the legacy preference, because it disproportionately benefits White and wealthy students. The move was fiercely opposed by alumni, but according to admissions vice president Nancy McDuff, the university “has not encountered noticeable fundraising challenges as a result of the change.” Along with other steps—such as adding considerations of socioeconomic status (SES) to admissions decisions—the elimination of legacy preferences helped the University of Georgia to match earlier levels of Black and Latino representation previously achieved through overt racial preferences.82
To overcome the burdens of poverty
and nonetheless perform at a high
level is itself an indicator of ability
and perseverance; true merit, properly
understood, recognizes both scholastic
achievement and the importance of the
distance traveled from a low income high
school to an elite college or university.
Redefining Merit to Include “Distance Traveled”
Public institutions have created three approaches to broadening their review of academic merit: (1) giving weight to SES factors in the admissions review, (2) holistic review in which applicants’ accomplishments are reviewed in context of their home and school environments, and (3) “percentage plans” under which the top students from each high school are offered admission to the state’s flagship universities. Some institutions apply these new processes across their entire applicant pool; others have designated a set percentage of enrollment slots to be filled using this alternative method.
To date, eight states have instituted new admissions preferences for low-income and working-class students of all races. These institutions assign points for factors that might put students at an academic disadvantage, including: concentrated neighborhood poverty, single parent home, lack of wealth or financial assets, first generation college goer, language spoken at home, poverty level of the applicant’s high school, and average SAT or ACT of the applicant’s high school.
In California, for example, the University of California-Los Angeles (UCLA) Law School adopted a class-based affirmative action program that takes into consideration both the SES of an applicant’s family (parental education, income, and net worth), and an applicant’s neighborhood (percentage of families headed by singleparent households, proportion of families on public assistance, and percentage who had not graduated from high school). The program roughly tripled the proportion of law students who were the first in their family to attend college, and African American applicants were 11.3 times as likely to be admitted through the SES program as other programs. UCLA bar passage rates reached an all-time high after the SES program replaced an earlier race-conscious program.83
Other institutions have adopted a policy of holistic review, in which—in contrast to need-blind review—reviewers are provided with in-depth contextual information about each applicant’s home and school, and charged with assessing the student’s accomplishments in light of what supports they were given and what obstacles they have overcome. At the University of California, Berkeley, for example, the admissions department provides readers with school-specific data, which is updated annually with information from the state Department of Education and Berkeley’s applicant pool, so that readers know critical personal information about each student, such as parental occupation, high school poverty level, or the range of SAT/ACT test scores in the student’s high school.84 Adding in SES factors to the admissions review provides readers with a context to evaluate both a student’s abilities and the obstacles that he or she has overcome. Indeed, new research released this past November suggests that simply providing admissions officers with this additional data increases the rate of admission of low-income students.85
The third strategy is so-called percentage plans, where state flagship universities offer admissions to the top students in each school or district. In Texas, California, and Florida, officials have created policies to admit students who graduated at the top of their high school classes. The Texan Top Ten Percent Plan, enacted by the state legislation, initially provided automatic admissions to students in the top ten percent of every high school class, irrespective of SAT or ACT scores; the figure was subsequently reduced to seven percent because of space constraints (percentage plan admits are capped at three-quarters of the freshman class).86 In part because of high levels of racial segregation in Texas high schools, the percentage plan has produced as much (indeed slightly greater) African American and Latino representation in 2004 as it had using race in the mid-1990s. The percentage plan also produced higher levels of SES diversity. The program has been supported both by liberal urban minority legislators and conservative rural lawmakers, as constituencies from both groups benefit. Research indicates that minority students admitted through the percentage plan have performed as well or better than White students admitted with slightly higher average test scores.87
Reducing Under-Matching Through Outreach and Financial Aid
Some institutions, rather than changing their admissions criteria, have sought to increase the representation of low-income students among the applicant pool. Recognizing that under-matching contributes to the under-representation of low-income students, six states have invested in creating new partnerships with schools located in low-income or minority neighborhoods. These partnerships fund regional admissions centers, recruitment weekends targeting underrepresented regions and high schools, efforts to increase community college transfer applications, and K-12 partnerships that offer college preparatory classes and high school courses offering college credit.
In two states, programs have been created specifically to facilitate transfer from community colleges to four-year universities to promote economic and racial diversity.88 In California, for example, after the 1996 voter ban on affirmative action, efforts were made to increase the proportion of students at UC campuses who transferred from community colleges. Because low-income and minority students disproportionately enroll at two-year colleges, recruiting top community college students can be an important source of SES and racial diversity for four-year institutions. UC recognized the high quality of these candidates and, over time, agreed to increase community college transfer enrollment by 50 percent. By 2008-09, more than one quarter of new students enrolling on UC campuses were community college transfers.89
The Cooke Foundation has been particularly involved in expanding access of community college students to four-year institutions. From 2006-2010, the foundation’s Community College Transfer Initiative (CCTI) made it possible for more than 1,000 community college students to transfer to highly selective four-year institutions, including Amherst, Bucknell, Cornell, Mount Holyoke, UC Berkeley, the University of Michigan at Ann Arbor, the University of North Carolina at Chapel Hill, and the University of Southern California. CCTI students were subsequently found to earn similar grades as the traditional entry students at these institutions. A number of these colleges and universities continued to admit substantial numbers of transfer students after the CCTI initiative was concluded. In light of the CCTI results and the Cooke Foundation’s own record of success in identifying high-ability community college transfer students who excel in their four-year institutions, it is surprising that some selective institutions such as Princeton still refuse to accept any community college students.
Some states have directly taken on the issue of the financial burden of attaining a college education for students with limited means. To reduce the economic burden of attending college, eight states have expanded financial-aid budgets to target high-achieving, lowincome students. At approximately the same time that Nebraska voters eliminated racial preferences in 2008, the University of Nebraska implemented College Bound Nebraska, an expanded financial aid program offering free tuition for all Nebraska residents who are Pell grant recipients, maintain a full course-load, and have a GPA of 2.5 or higher. The former President of the University of Nebraska, J.B. Milliken (now Chancellor of the City University of New York), declared, “We believe that focusing efforts on those with the greatest financial need and those who, historically, have had the lowest participation in higher education will help increase the diversity of our campus.” Combined with other programs to boost diversity without direct consideration of race, the expanded financial aid helped Nebraska maintain levels of Black and Hispanic representation that had previously been achieved using racial preferences.90
Consequences of Broadening Access for Low-Income Students
Incorporating recognition of the determination and resolve to overcome the burdens of growing up in a low-income family will not result in a dilution of academic standards and admission of students who cannot do the work. Research and experience both suggest that there are many talented low-income students who can succeed at a high level at even the most selective colleges and universities.
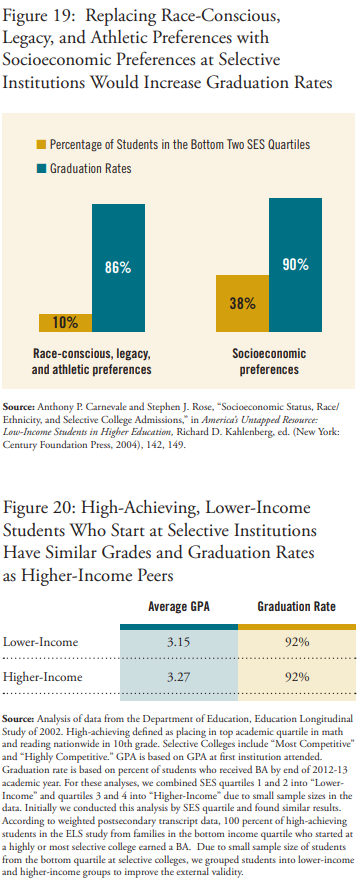
In simulations drawing on actual admissions data, researchers have found that eliminating current preferences for legacies, athletes, and minority students and instead giving a boost to socioeconomically disadvantaged students would actually produce a slight rise in graduation rates.91 As shown in Figure 19, existing preferences actually hurt the quality of the existing college class. Under the existing race-conscious, legacy, and athletic preference system at examined selective institutions, ten percent of students admitted came from the bottom two SES quartiles, and 86 percent of students graduated. If such preferences were dropped and replaced with preferences for students from a low-SES background, selective institutions could increase the percent of students from the bottom two SES quartiles to 38 percent while increasing the overall institutional graduation rate to 90 percent.92
To further confirm that increasing admission of high-achieving, low-income students would not reduce selective college graduation rates, we used the U.S. Department of Education’s Education Longitudinal Study to analyze these students’ educational progression. High-achieving, lower-income students—here defined as students who placed in the top academic quartile in 10th grade and came from families below the median income—who enrolled at a selective institution do well there, earning an average GPA over 3.0, and completing degrees with graduation rates over 90 percent. We also found that high-achieving students in the bottom two income quartiles earn similar grades and graduate at the same rate as those from families in the top two income quartiles (Figure 20).
Racial Diversity
Should the Supreme Court rule that race-conscious affirmative action is unconstitutional, institutions will need to look to other strategies to maintain racial and ethnic diversity on their campuses. Recognizing the strength of high-achieving, low-income students in admissions can produce as much or more racial and ethnic diversity as current race-conscious affirmative action policies.93 Indeed, the majority of institutions which have created race-neutral strategies in response to bans on race-conscious affirmative action were able to replicate earlier levels of African American and Latino representation achieved using race as a factor in admissions.94
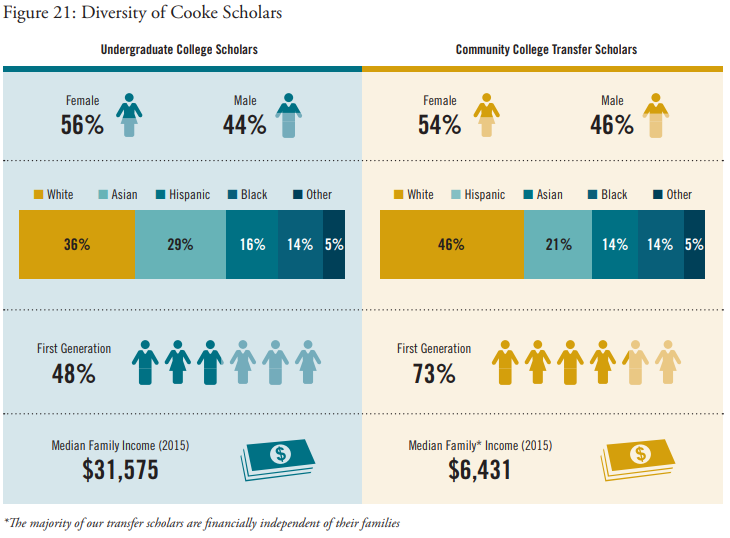
The experience of the Cooke Foundation further bears out that selection of high-achieving, low-income students can produce ethnic and racial diversity while maintaining or actually improving academic selectivity. Cooke Scholarships are awarded based on academic merit, leadership, commitment to others, and financial need. Characteristics such as gender, race, and ethnicity are not considered in the selection process. Yet the resulting pool of Cooke Scholars is diverse across these categories (Figure 21). The Cooke Foundation’s experience suggests that a race-blind system of selection focused on high-achieving, economically disadvantaged students, can yield high levels of racial diversity.
Appendix C