Persistence: The Success of Students Who Transfer from Community Colleges to Selective Four-Year Institutions
Part 1: Transferring from Community Colleges to Selective Institutions
How many students transfer to selective institutions from community colleges?
The Entering Undergraduate Class of 2016
In 2016, over 2.6 million students enrolled at a four-year institution for the first time as undergraduates (Exhibit 1). We call these students the 2016 Entering Class, and use this sample as the frame for this report.
Students are part of the 2016 Entering Class if they meet all of the following criteria:
- They were enrolled as an undergraduate at a four-year institution in fall 2016.
- They had not been previously enrolled at that four-year institution prior to fall 2016.
- They had not earned a bachelor’s or higher degree from any institution prior to fall 2016.
Students in the 2016 Entering Class may have been enrolled previously at another two-year or four-year institution, but fall 2016 was their first semester at their fall 2016 institution. The 2016 Entering Class includes full- and part-time students, and degree- and non-degree-seeking students.
In other words, the 2016 Entering Class represents all undergraduate students for whom fall 2016 was their first semester enrolled at their specific institution.
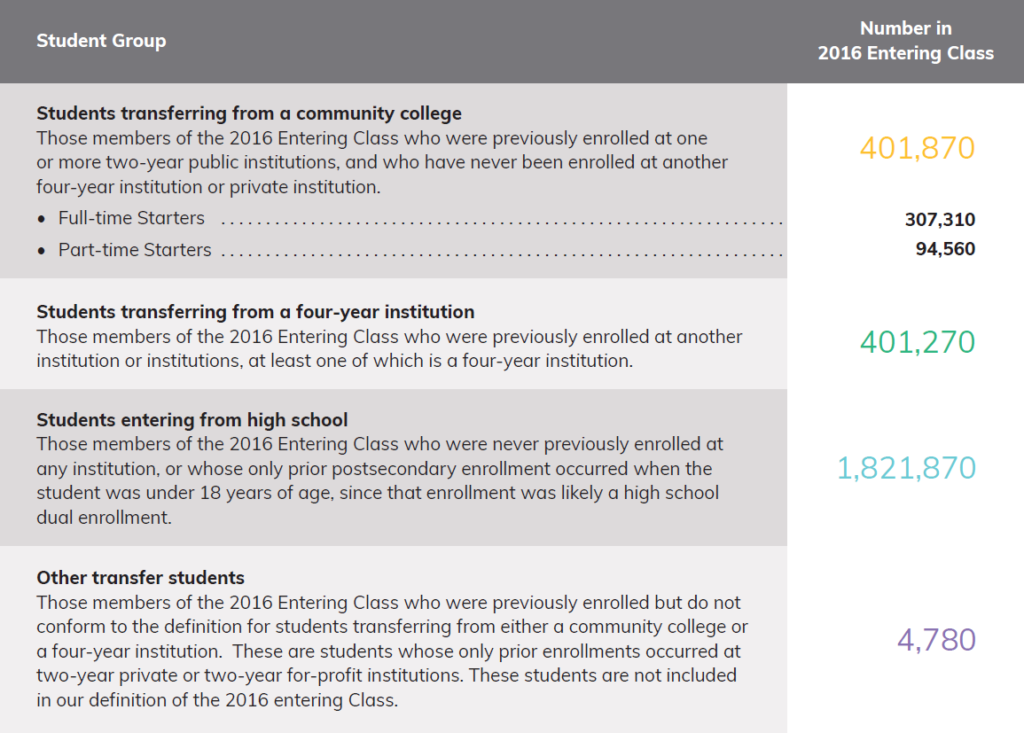
Transfer students, whether from a two-year or four-year institution, make up nearly one-third (30 percent) of the 2016 Entering Class. The transfer population is evenly split between community college transfer students (15 percent) and four-year transfer students (15 percent). Over 400,000 students transferred from a community college to start at a four-year institution in 2016.
Transfer to Selective Colleges and Universities
While 21 percent of students enrolling directly from high school enter a selective institution (i.e., Most or Highly Competitive), only 9 percent of students transferring from a community college do the same (Exhibit 2). The result is a skewed distribution across the higher education landscape, with selective institutions less likely to enroll community college transfer students than other students.
The percent of an institution’s undergraduates who transfer from a community college increases as institutional selectivity decreases (Exhibit 3). The two-year transfer population at Less Competitive institutions (21 percent) is four times that of Most Competitive institutions (5 percent) and twice that of Highly Competitive institutions (10 percent). Collectively, 7 percent of students enrolled at a Most or Highly Competitive institution transferred from a community college in 2016.
Yet we find that all selective colleges and universities enrolled at least one new undergraduate in fall 2016 from a community college (Exhibit 4). While 85 percent of Most Competitive institutions enroll fewer than five percent of their students from community colleges, we find four Most Competitive institutions that enroll at least 10 percent of their undergraduates as community college transfer students. Three of them are public.
We also observe in Exhibit 4 that transfer rates at less selective institutions range broadly from less than 5 percent to more than 20 percent. This suggests that enrolling transfer students is not simply a function of selectivity, but may also be an enrollment management choice.
Exhibit 1: Composition of the 2016 Entering Class
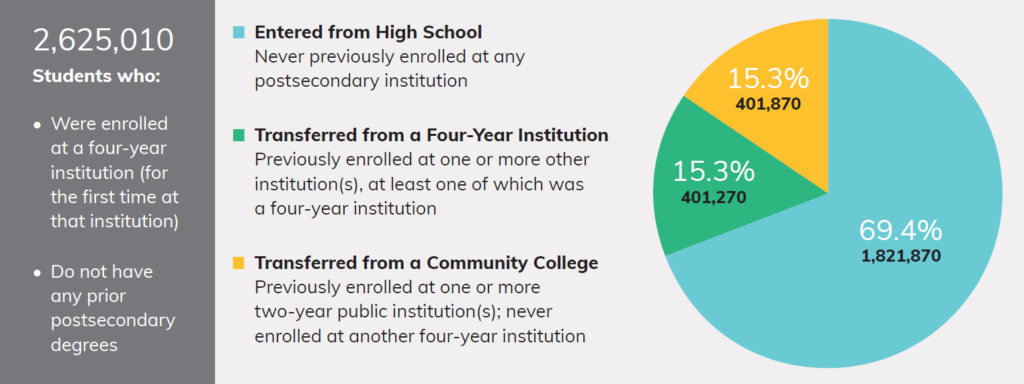
Note: Numbers are rounded to the nearest 10s place. The National Student Clearinghouse (NSC) data also contains 4,780 students who were previously enrolled at either a two-year private or two-year for-profit institution, which equals 0.2 percent of all students. As these types of institutions vary widely in scope and program type, these students are excluded from this report.
Exhibit 2: Selectivity of Institutions Attended by 2016 Entering Class, by Student Type
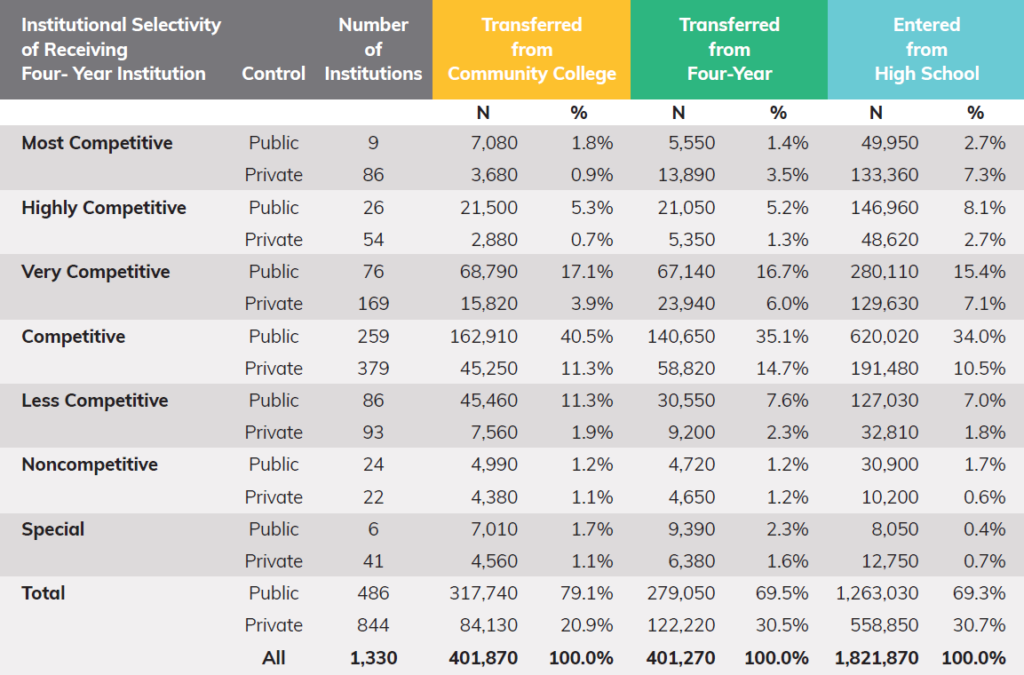
Note: Reporting on all 1,330 institutions in the NSC database. Student counts are rounded to the nearest 10s place. Percentages may not sum to 100 percent due to rounding.
Exhibit 3: Distribution of New Undergraduates across Institutions (Percent of students in the 2016 Entering Class)
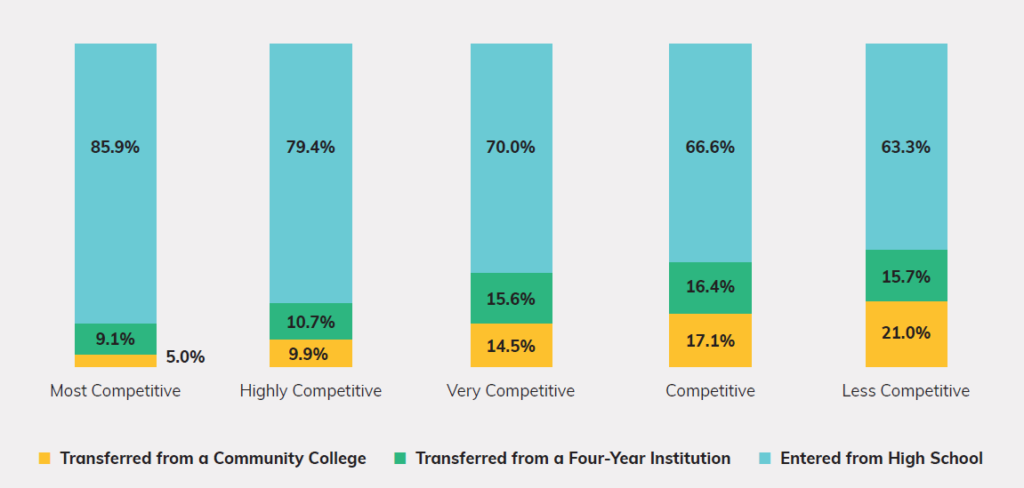
Note: Reporting on 2,517,030 students enrolled at 1,237 institutions in the NSC database.
Exhibit 4: Number of Institutions Enrolling Various Levels of Community College Transfer Students
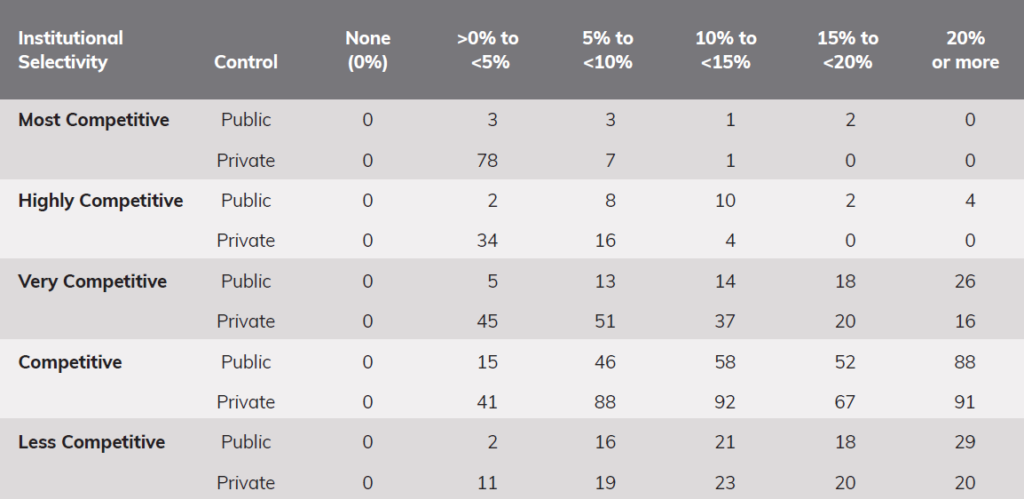
Note: Reporting on 1,237 institutions in the NSC database. Exhibit reports the number of institutions in each selectivity category that enrolled various levels of community college transfer students in their fall 2016 entering cohort.
Public versus Private
Public institutions enroll four times as many community college transfer students as private institutions: 305,730 versus 75,190, respectively. This is not just because they are larger but also because transfer students make up a larger percentage of their enrollment (Exhibit 5). Overall 17 percent of the 2016 Entering Class at public institutions come from community colleges, compared to 10 percent at private institutions.
Public institutions enroll more community college transfer students than private institutions across all selectivity bands (Exhibit 6). Indeed, the nine public institutions ranked Most Competitive enroll more than twice as many transfer students as the 86 private institutions in this category (Exhibit 2).
Affordability may be a key driver of this trend, reflecting lower tuition prices at public institutions. Public institutions are also more likely to have relationships with local community colleges that facilitate transfer. For example, the University of California campuses at Berkeley15 and Los Angeles16 partner with community colleges throughout the state to provide community college students with information about transferring and to facilitate the transfer process. The University of California system also guarantees UC admission to any California community college students who graduate with their associate degree having taken specified courses and earned a certain grade point average.17
Private institutions can also increase transfer options. Between 2006 and 2014 the Jack Kent Cooke Foundation partnered with highly selective colleges and universities under the auspices of its Community College Transfer Initiative (CCTI). The results: in just three years, almost 1,100 students matriculated into the eight inaugural CCTI institutions, where they went on to attain a 3.0 average GPA.18 More recently, in 2018, the Board of Governors of the California Community Colleges approved an agreement allowing dozens of private, nonprofit Californian colleges and universities to accept community college transfer students as juniors, provided the students meet certain requirements and take specific courses.19
Trends over Time
The percentage of undergraduates transferring from community colleges has remained flat or slightly declined over the past 10 years at the nation’s selective institutions (Exhibit 7). In contrast, other institutions have seen an uptick in the percentage of students transferring from community colleges. Between 2007 and 2016, at the Most Competitive institutions, the proportion of undergraduates coming from community colleges declined from six to five percent.
Exhibit 5: 2016 Entering Class by Institution Type (Undergraduate Students)
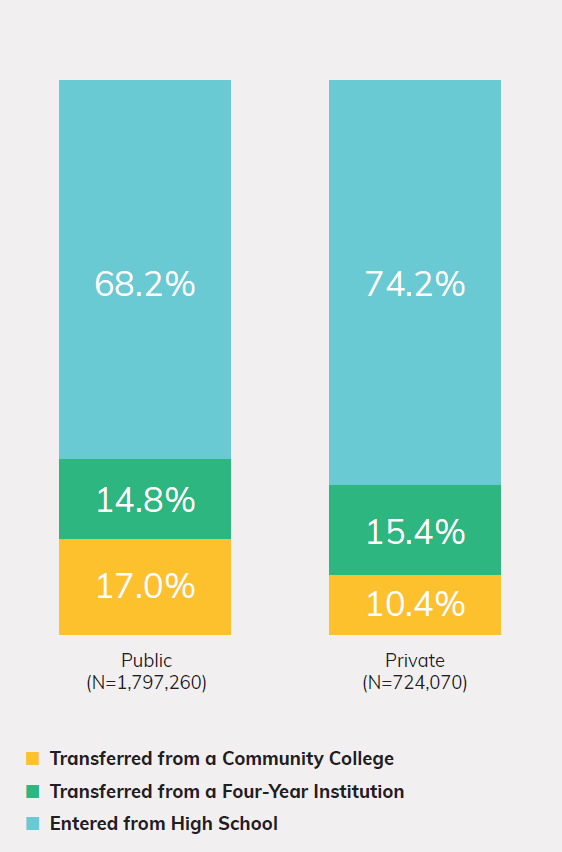
Note: Numbers are rounded to the nearest 10s place.
Exhibit 6: Percent of Undergraduate Enrollment Transferring from Community College, by Institutional Control and Selectivity
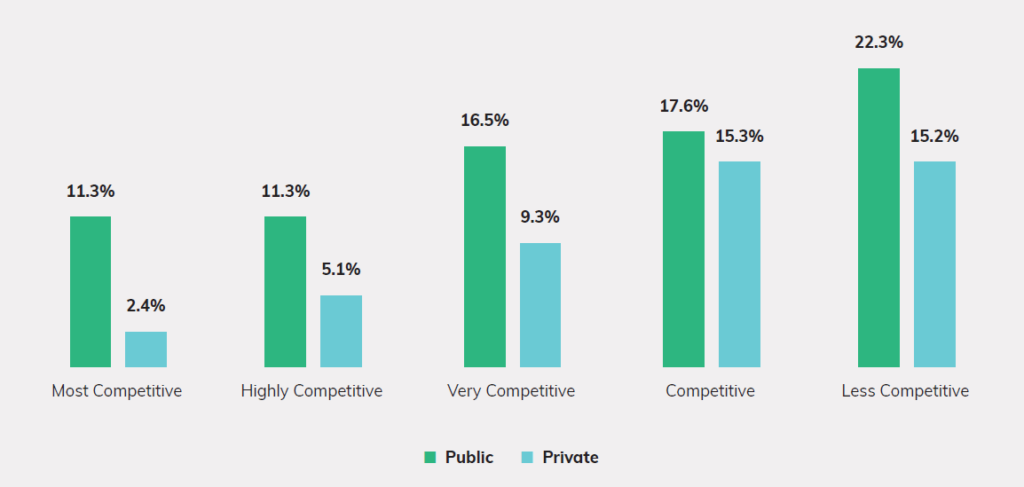
Note: Reporting on 1,237 institutions in the NSC database. Exhibit reports the percent of students in the 2016 Entering Class who transferred from a community college to a four-year institution.
Exhibit 7: Percent of Undergraduates Transferring from Community College, 2007 – 2016
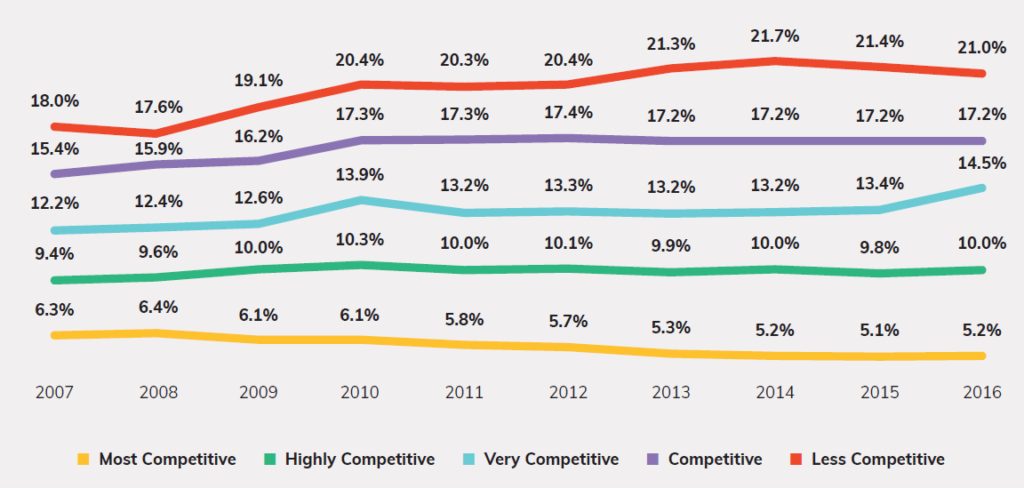
Note: Longitudinal data presented for all institutions that participated in the National Student Clearinghouse in all years between 2007 and 2016.
Part 2: Community College Characteristics
From what types of community colleges do students transfer to selective four-year institutions?
In this section we examine the characteristics of community colleges that send students to selective (i.e., Most Competitive and Highly Competitive) four-year institutions. Data are drawn from the 932 two-year colleges that have submitted data to the National Student Clearinghouse at any point since its founding in 1993, which are largely representative of all public two-year institutions in the U.S.20
Transfer students are present at nearly all community colleges. All but four community colleges in our dataset (i.e., 99 percent) transferred one or more students to four-year institutions in fall 2016. The four that did not were all small; three of them were non-degree granting schools.
Furthermore, transfer students with the academic credentials to be offered admission at selective colleges or universities are also present on the majority of community college campuses. We find that students who transfer to selective colleges and universities come from hundreds of different community colleges across the nation.
Fully 84 percent of the nation’s two-year institutions transferred at least one student to a selective four-year institution in fall 2016 (Exhibit 8).
Exhibit 8: Rate of Transfer from Community Colleges
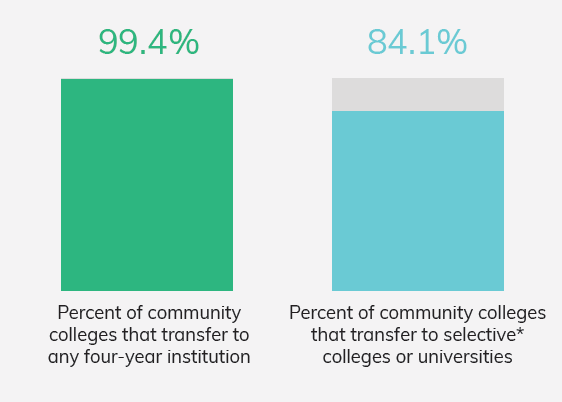
* Selective includes Most Competitive and Highly Competitive institutions
Source: 2016 Entering Class
Demographic and Programmatic Characteristics of Community Colleges Transferring Students to Selective Institutions
Students transfer to selective colleges from community colleges of all types and sizes. That said, community colleges with larger enrollments, situated in more urban areas, and offering honors programs are more likely to transfer students to selective institutions.
Key findings include the following:
- Honors colleges are not common among community colleges; only 17 percent of the community colleges examined for this study reported having an honors program or college. Among those schools, however, almost all (96 percent) had students who transferred to selective four-year institutions, compared with 82 percent of all other community colleges (Exhibit 9).
- Just over half (57 percent) of small community colleges sent one or more students to selective four-year institutions. In contrast, all large schools enrolled some students that subsequently went on to a selective college, and the majority (91 percent) of medium sized community colleges sent students on to selective institutions (Exhibit 10).
- Community colleges in all regions transferred students to selective four-year colleges. Two-year schools in the Southeast and Rocky Mountain regions were least likely to send students to selective institutions, while nearly all community colleges in the Far West region sent students on to selective institutions (Exhibit 11).
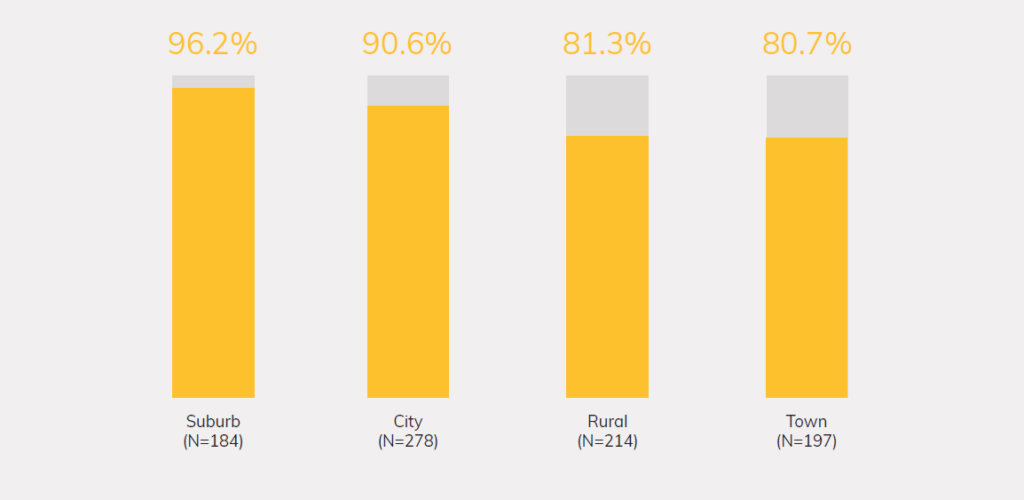
- Suburban and city community colleges were more likely to transfer students to selective institutions than those in rural areas (Exhibit 12).
- Community colleges transferring students to selective institutions are located in all 50 states (Exhibit 13). States where every community college transferred at least one student to a selective four-year institution
include California, Connecticut, Delaware, Hawaii, Massachusetts, Maryland, Missouri, New Jersey, Tennessee, and Virginia.
Multiple factors may contribute to these trends. Larger community colleges may be more likely to host honors programs or to have articulation agreements in place with four-year institutions. Urban and suburban community colleges may have stronger relationships with selective schools, and students attending community colleges in these types of communities may be more aware of the possibility of transferring to selective institutions. Selective schools tend to be concentrated in urban and suburban areas making them more visible to students in these communities. Degree programs at rural community colleges may also focus more on credentials useful for the workplace, rather than transfer-readiness.
Exhibit 9: Percent of Community Colleges Transferring Students to Selective* Institutions, by Presence of Honors College or Program
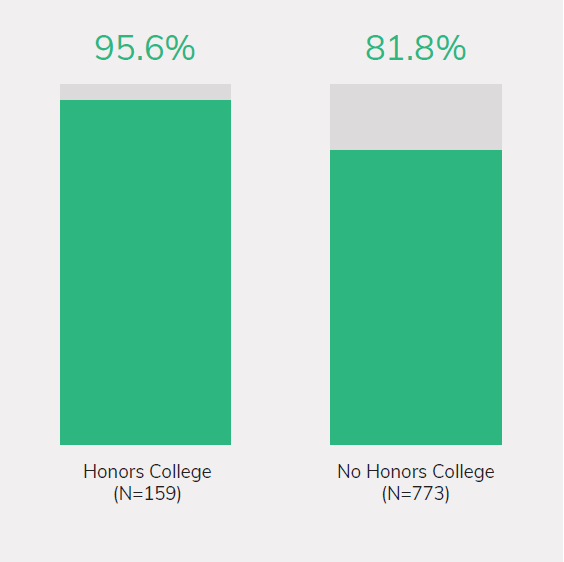
*Most Competitive / Highly Competitive
Exhibit 10: Percent of Community Colleges Transferring Students to Selective* Institutions, by Size
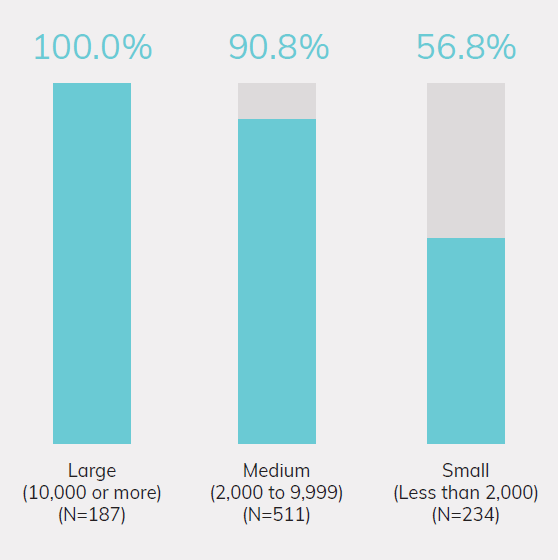
*Most Competitive / Highly Competitive
Exhibit 11: Percent of Community Colleges Transferring Students to Selective* Institutions, by Region
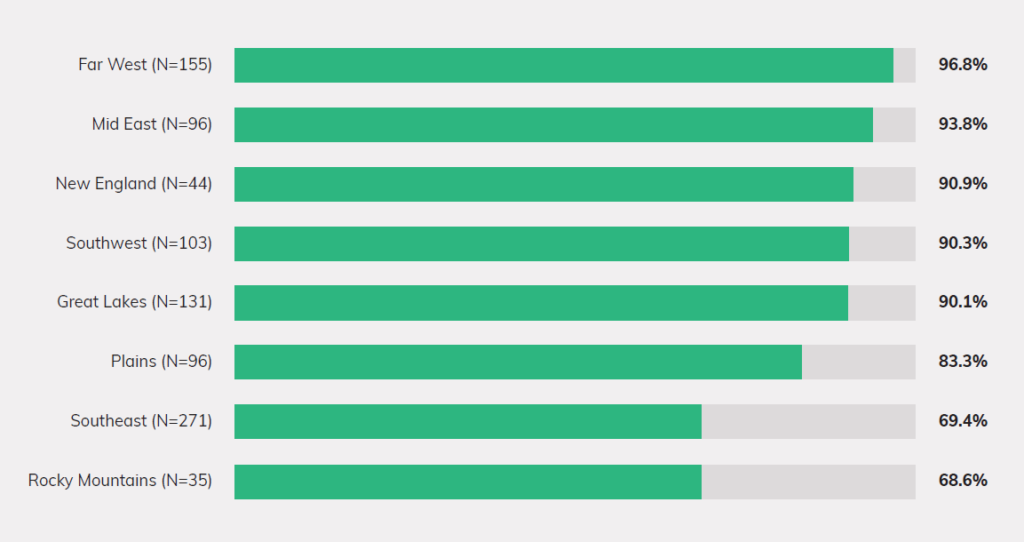
*Most Competitive / Highly Competitive
Note: Regions based on Bureau of Economic Analysis region definitions.
Exhibit 12: Percent of Community Colleges Transferring Students to Selective* Institutions, by Urbanization
*Most Competitive / Highly Competitive
Exhibit 13: Percent of Community Colleges Transferring Students to Selective* Institutions, by State
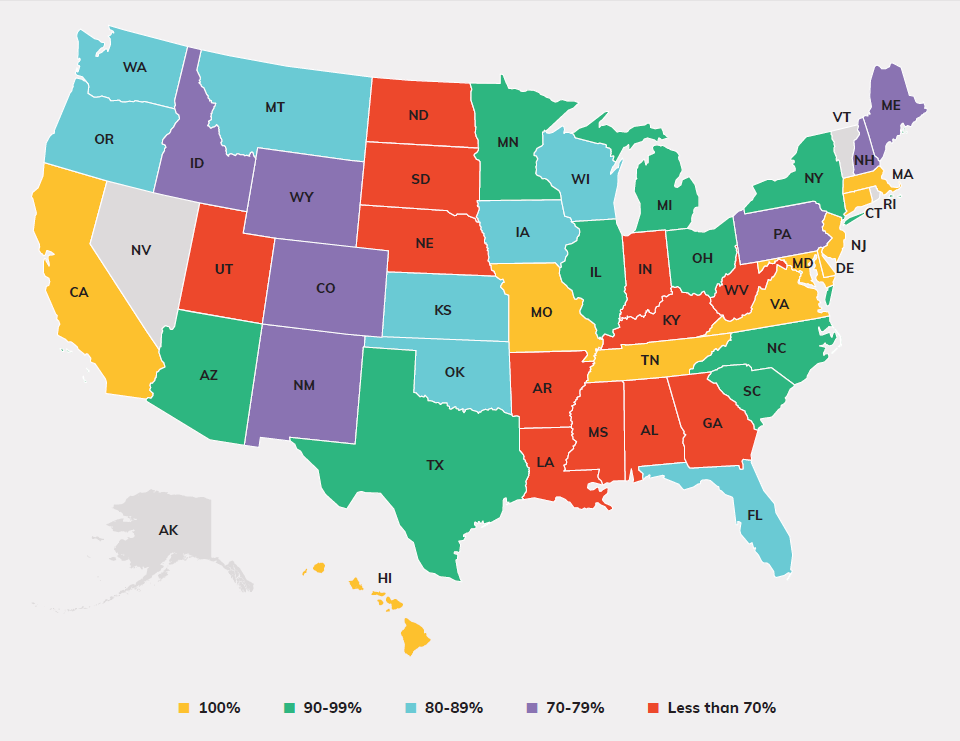
*Most Competitive / Highly Competitive
Note: Alaska, Nevada, Rhode Island, Vermont, and U.S. territories are excluded as only one community college from each of those areas appears in the dataset.
Part 3: Outcomes of Students Who Transfer from Community Colleges to Four-Year Institutions
What happens to students who transfer from community colleges to selective four-year institutions?
In the remainder of this report, we shift our focus from enrollment to completion. Using the same methodology as the first half of this report, we define the 2010 Entering Class as those undergraduate students who meet the following criteria:
- They were enrolled at a four-year institution in fall 2010.
- They had not been previously enrolled at that four-year institution prior to fall 2010.
- They had not earned a bachelor’s or higher degree from any institution prior to fall 2010.
These students were tracked forward in time through 2016, to examine completion rates.
In fall 2010, over 360,000 students successfully transferred from a community college to a four-year institution. One of every 12 of these students (8 percent, approximately 30,000 students) transferred to a selective (i.e., Most Competitive or Highly Competitive) institution. In this section we examine the success rates of those students in completing their bachelor’s degree, as well as success rates of community college students who transferred to other types of institutions.
Exhibit 14: Elapsed Time between Leaving Community College and Enrolling in Four-Year Institution
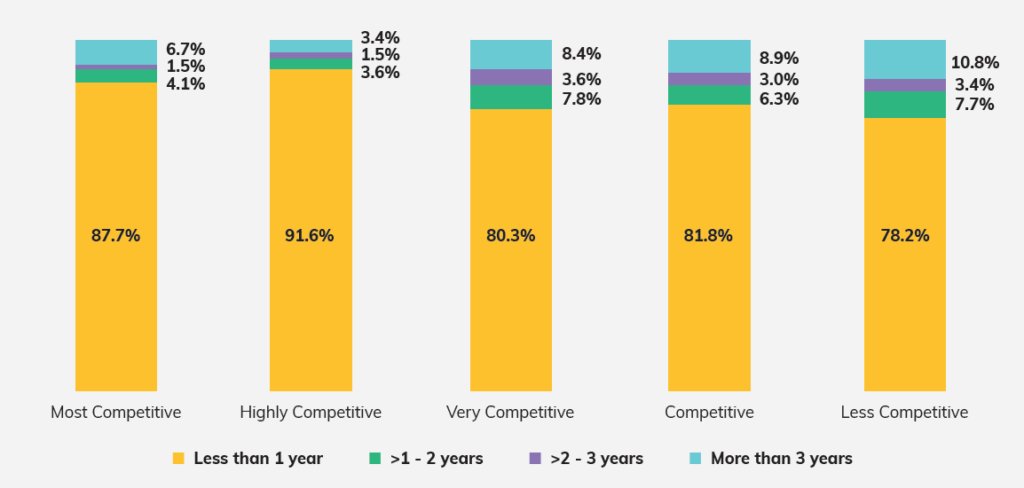
Note: Reporting on 342,780 students who transferred from a community college to a four-year institution in fall 2010. Numbers are rounded to the nearest 10s place.
Trajectories of Students Transferring from Community Colleges to Selective Four-Year Institutions
Most community college students that entered a four-year university in 2010 did so within one year of leaving community college. Students transferring to selective institutions are more likely to transfer quickly, and less likely to wait longer than three years before transfer, than students transferring to other types of four-year institutions (Exhibit 14).
Most community college transfer students do not earn an associate’s degree prior to enrolling in a four-year institution (Exhibit 15). This is consistent with research conducted by the Community College Research Center at Teachers College, Columbia University, which shows that 29 percent of transfer students earn a certificate or associate’s degree.21 We find that students who transfer to more selective institutions are less likely to have earned an associate’s degree before transferring than those who transfer to less selective institutions. This may be because these students enter community college already intending to transfer, thus completing an associate’s degree is not a goal. It may also reflect student’s awareness that selective colleges and universities are less likely to accept community college transfer credits.
Exhibit 15: Percent of Community College Transfer Students Receiving an Associate’s Degree Prior to Transfer
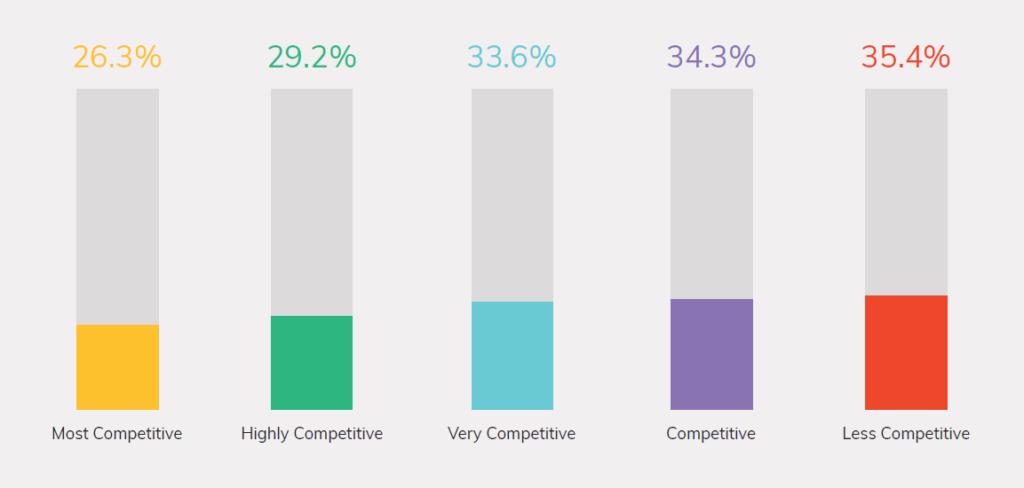
Note: Reporting on 342,780 students who transferred from a community college to a four-year institution in fall 2010. Numbers are rounded to the nearest 10s place.
Transfer Outcomes
Community college students who transfer to selective institutions are more likely to be enrolled one year after matriculation and more likely to earn their bachelor’s degree than students who transfer elsewhere. Furthermore, they do so in less time than transfer students earning degrees at other types of institutions. We find that:
- Eighty-eight percent of transfer students at Most Competitive institutions are still enrolled one year after transfer, compared with 76 percent of students at Less Competitive schools (Exhibit 16).
- Three-quarters of community college students who transfer to a Most Competitive institution receive their bachelor’s degree, compared to only half who transfer to Less Competitive schools: 76 percent versus 53 percent (Exhibit 17).
- Degree recipients at Most Competitive institutions take slightly less time on average to earn their degree than students at Less Competitive institutions: 2.6 versus 2.8 years (Exhibit 18). This may be because students enrolling at Most Competitive institutions successfully transfer in significant numbers of credits, or that they are more likely to enroll full-time.
These findings indicate that previous enrollment at a community college does not preclude academic success at a four-year institution, including the nation’s most selective institutions. These data do not disaggregate results by student income level. It is possible that outcomes for lower-income students differ from those for higher-income students.
Exhibit 16: One Year Retention Rates of Community College Transfer Students, by Institutional Selectivity
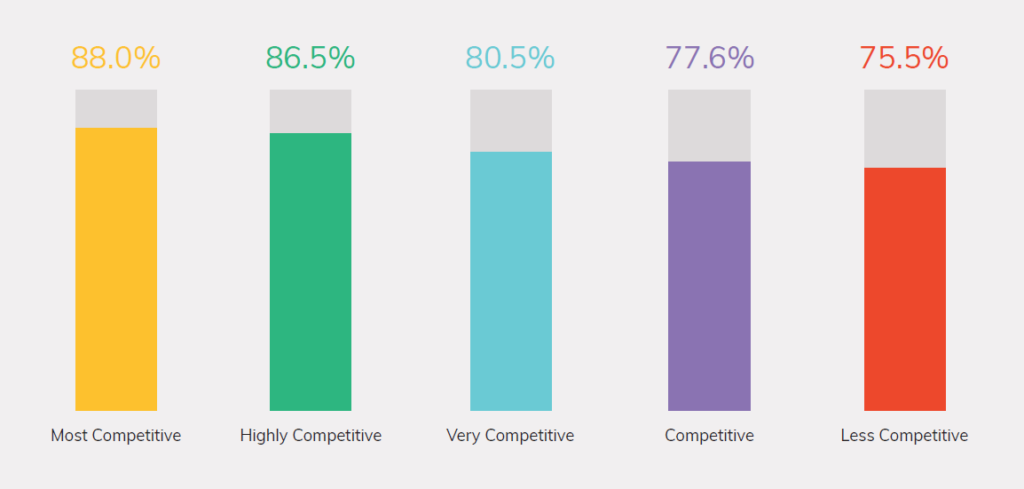
Note: Reporting on 342,780 students who transferred from a community college to a four-year institution in fall 2010. Numbers are rounded to the nearest 10s place.
Exhibit 17: Six-Year Graduation and Retention Outcomes for Community College Transfer Students, by Institutional Selectivity
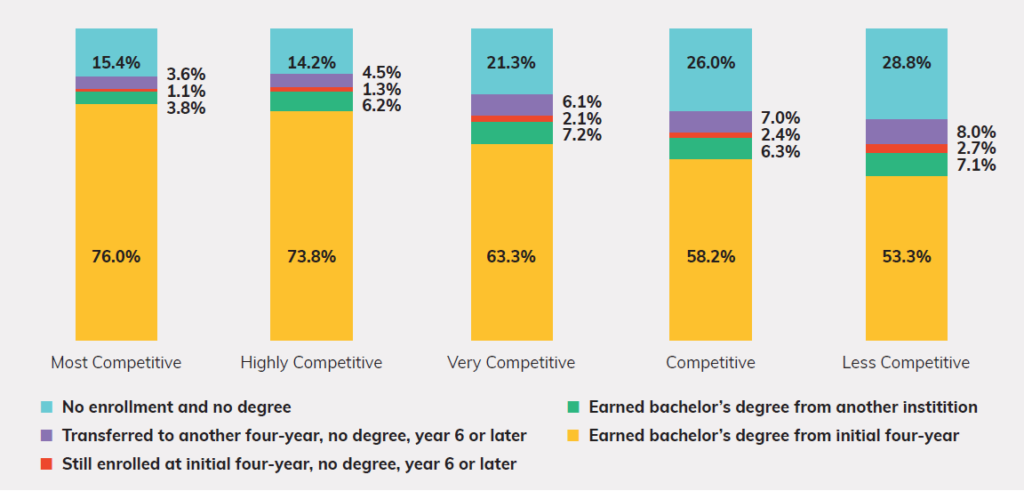
Note: Reporting on 342,780 students who transferred from a community college to a four-year institution in fall 2010. Numbers are rounded to the nearest 10s place.
Exhibit 18: Average Time (Years) to Degree for Community College Transfer Students Graduating from the Receiving Institution
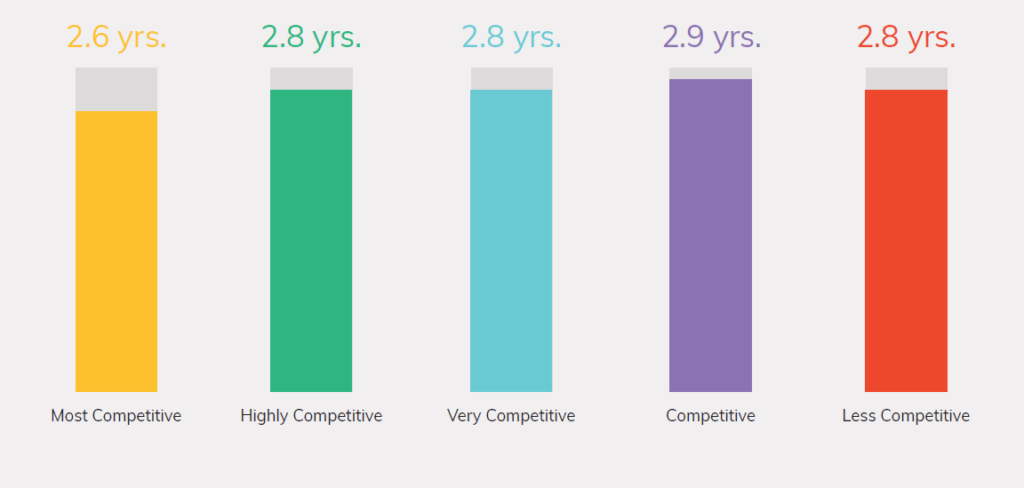
Note: Reporting on 205,710 students who transferred from a community college to a four year institution in fall 2010 and subsequently earned a bachelor’s degree from that institution. Time to degree calculated as number of days between first date of enrollment at the four-year institution and graduation date (divided by 365). Time to degree only calculated for students who earned the bachelor’s degree.
Part 4: Outcomes of Community College Transfer Students Compared with Other Students
How do the persistence outcomes of community college transfer students compare to other students enrolled at four-year institutions?
Not only do students who transfer to selective institutions (i.e., Most Competitive or Highly Competitive) from community colleges persist and earn their degrees, but they are more likely to do so within six years of matriculation than students who enroll straight from high school or transfer from other four-year institutions (Exhibit 19).
Examining the 2010 Entering Class, we find that community college transfer students have roughly equal one-year retention rates to students enrolling from high school, and higher one-year retention rates than those students transferring from other four-year institutions (Exhibit 20). While researchers have documented the “transfer shock” phenomenon, in which transfer students experience a temporary decrease in grade point average during their first year on campus, such shock does not appear to affect community college transfer students’ persistence.
Exhibit 19: Six-Year Graduation Rates of Undergraduate Students at Selective Colleges and Universities
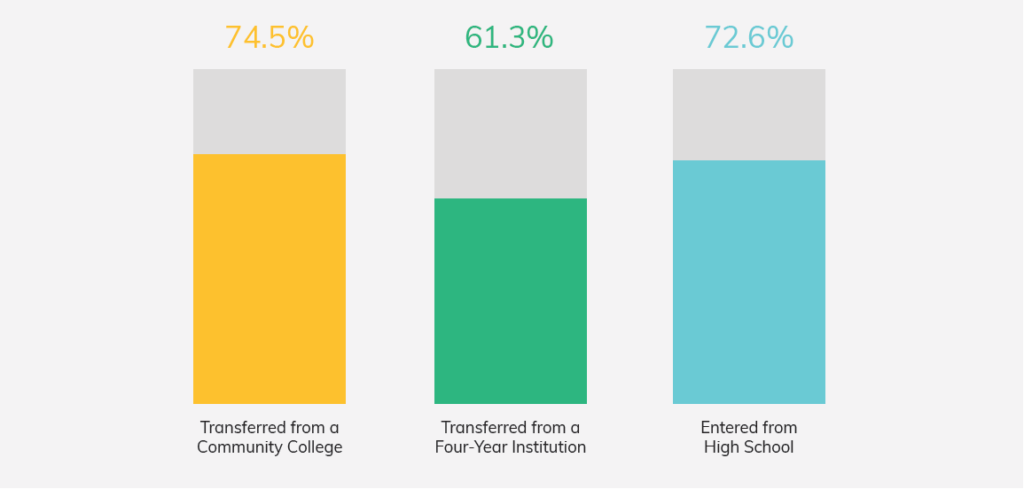 Note: Reporting on the graduation outcomes of 363,130 students who enrolled at a selective institution in fall 2010. Selective colleges and universities include those designated as either “Most Competitive” or “Highly Competitive” by Barron’s. Students included in these analyses include full-time and part-time students, as well as both degree-seeking and non-degree-seeking students. For more discussion of the methodology of calculating these graduation rates and how they compare to other graduation rates reported by institutions to the Department of Education, please see Appendix A.
Exhibit 20: One-Year Retention Rates, By Student Type and Institutional Selectivity
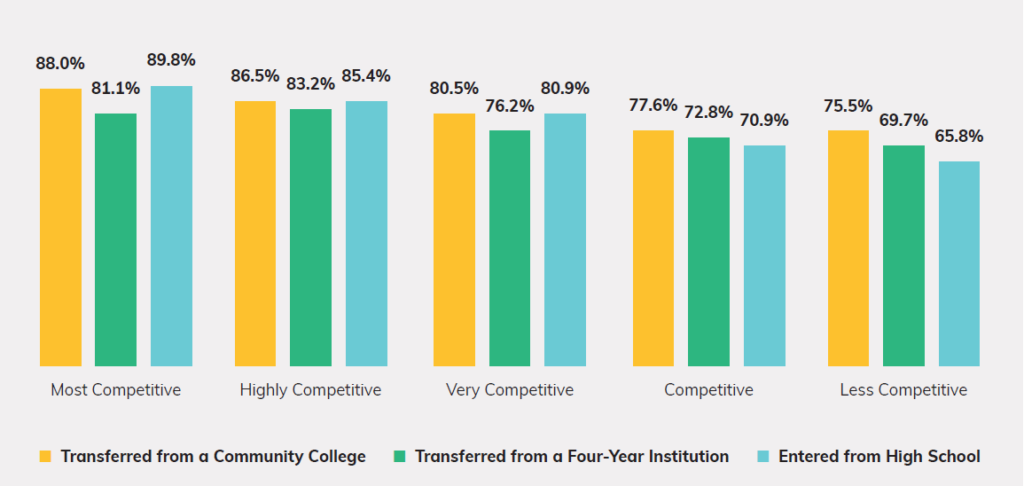
Note: Reporting on the retention outcomes of 2,238,570 students who enrolled at a four-year institution in fall 2010.
Exhibit 21: Six-Year Graduation Rates, By Student Type and Institutional Selectivity
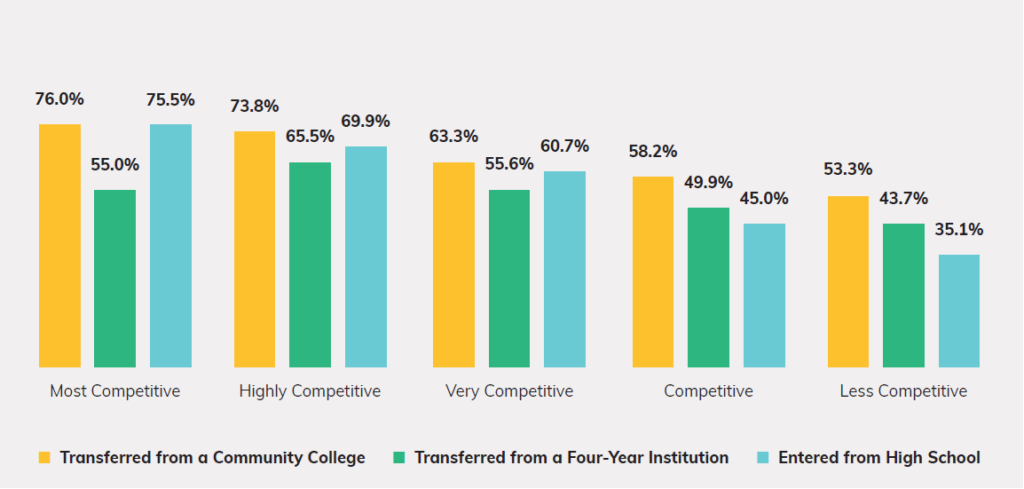
Note: Reporting on the retention outcomes of 2,238,570 students who enrolled at a four-year institution in fall 2010. For a discussion of the methodology of calculating these graduation rates and how they compare to other graduation rates reported by institutions to the Department of Education, please see Appendix A.
Furthermore, we find that community college transfer students have equal to higher graduation rates than students enrolling from high school or transferring from other four-year institutions (Exhibit 21). This trend holds true across all selectivity categories. At Most Competitive institutions, 76.0 percent of community college transfer students graduate within six years of transferring, on par with a 75.5 percent graduation rate for students entering from high school.
Students transferring from community colleges are equally likely to major in business, social sciences, or psychology as students entering from high school or transferring from other four-year institutions, but less likely to pursue a degree in biological sciences or engineering (Exhibit 22). Lower rates of transfer students majoring in scientific and engineering fields may reflect the strict structuring of coursework in those fields or students’ inability to take required prerequisites.
Exhibit 22: Discipline of Earned Bachelor’s Degree, Selective Institutions
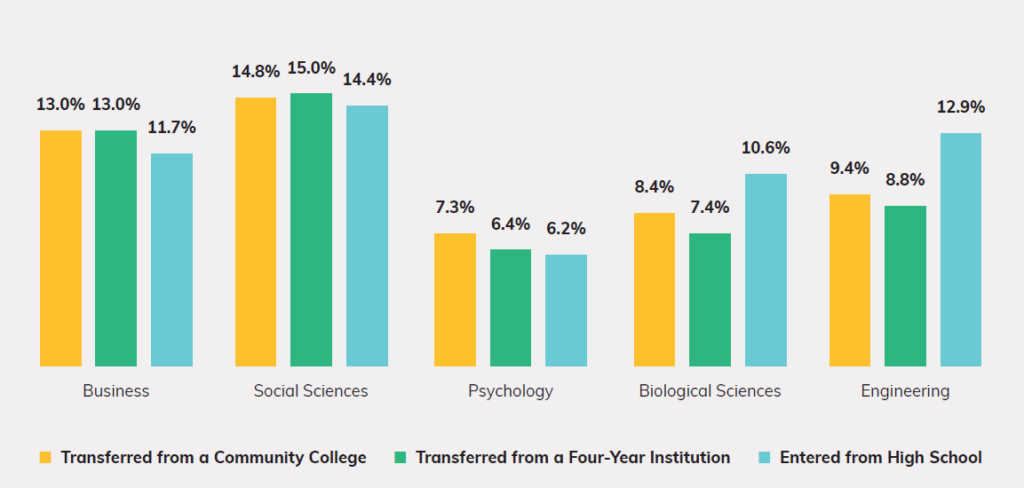
Note: Reporting the top five reported degree disciplines among 255,390 students who received a bachelor’s degree from the Most Competitive or Highly Competitive institution they first entered in fall 2010.
Appendix A: Samples and Methodology
Samples
Part 1 examines the enrollment patterns observed at four-year institutions of the 2016 Entering Class, defined as all students enrolled in a term beginning between August 15, 2016 and December 31, 2016 who were enrolling in that institution for the first time, and had not earned a bachelor’s or higher degree from any institution prior to fall 2016. These students include both full- and part-time students; they include both degree-seeking and non-degree-seeking students. Public and private institutions were included; for-profit institutions were excluded. All told, 2,629,790 students were examined as part of the 2016 Entering Class. These students were classified as shown in Table 1:
Table 1: 2016 Entering Class
Numbers rounded to the nearest 10s place.
Part 2 examines the characteristics of community colleges from which students are most likely to transfer to selective institutions. A total of 932 community colleges were included in this dataset, consisting of all institutions that submitted enrollment data to the Clearinghouse at any point since the founding of the Clearinghouse. This set of institutions includes some that have since merged with other institutions and/or closed. Enrollment data for these schools were obtained from the fall 2015 Undergraduate Enrollment data file of the Integrated Postsecondary Education Data System at the Department of Education (IPEDS variable: “Grant Total EF2015 All students Undergraduate total”). Region is based on the Bureau of Economic Analysis region definitions. Location coded by IPEDS (IPEDS variable: “Degree of urbanization (Urban-centric local) HD2015”).
Parts 3 and 4 of this study examine enrollment patterns and outcomes of students initially enrolled in the 2010 Entering Class, defined as including all students enrolled at a four-year institution in an academic term beginning between August 15, 2010 and December 31, 2010 who were enrolling in that institution for the first time, and had not earned a bachelor’s or higher degree from any institution prior to fall 2010. The same definitions used in Part One are used here, with student counts as outlined in Table 2.
Outcome Definitions — 2010 Entering Class
Elapsed time between leaving community college and enrolling in four-year institution (Exhibit 14) is calculated by determining the begin date of the student’s earliest enrollment record at the four-year institution, and the end date of the student’s latest enrollment record (prior to May 31, 2010) at the community college, subtracting to determine the difference in days, and converting into calendar years using [years = days/365].
One-year retention rates (Exhibit 16) were calculated as the percentage of students who had completed their degree or were still enrolled after one year.
Six-year graduation rates (Exhibit 17) were calculated as the percentage of students who earned their bachelor’s degree from the initial enrolling four-year institution within six years of initial enrollment. Students include those enrolled as both full-time and part-time students as well as both degree-seeking and non-degree-seeking students. As a result, the graduation rates reported in this report are lower than “Student Right-to-Know” graduation rates reported by institutions to the Department of Education, which are limited to first-time, full-time, degree-seeking students.
Enrolled Time To Degree (Exhibit 18) is calculated by determining the begin date of the student’s first enrollment record at the receiving four-year institution, and the end date of the student’s bachelor’s degree awarded date, subtracting to determine the difference in days, and converting into calendar years using [years = days/365].
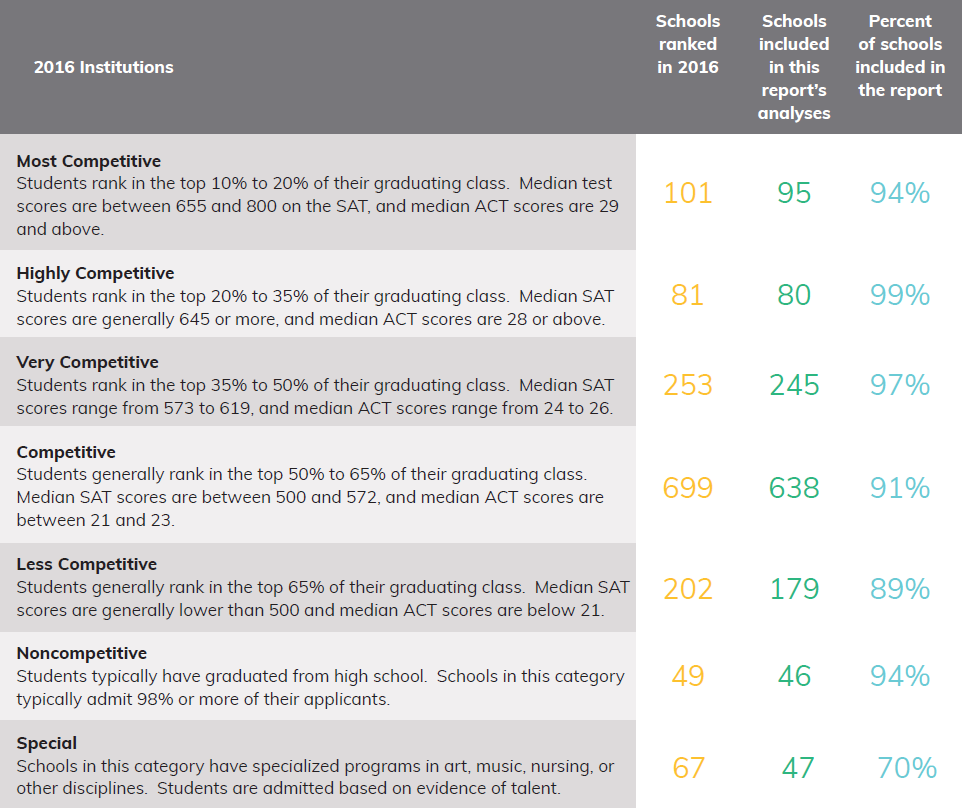
Selectivity
This report utilizes the Barron’s 2016 Competitiveness Index to examine transfer and enrollment patterns by institutional selectivity. Barron’s categorizes institutions into seven categories: Most Competitive, Highly Competitive, Very Competitive, Competitive, Less Competitive, Noncompetitive, and Special. We focus on the first five categories, with a particular focus on selective institutions, which we define as Most and Highly Competitive institutions. Few students enrolled in Noncompetitive and Special institutions, therefore we omitted these schools from some of the analyses. Table 3 below documents the number of schools in each category included in this report’s analyses of the 2016 Entering Class.
Table 2: 2010 Entering Class
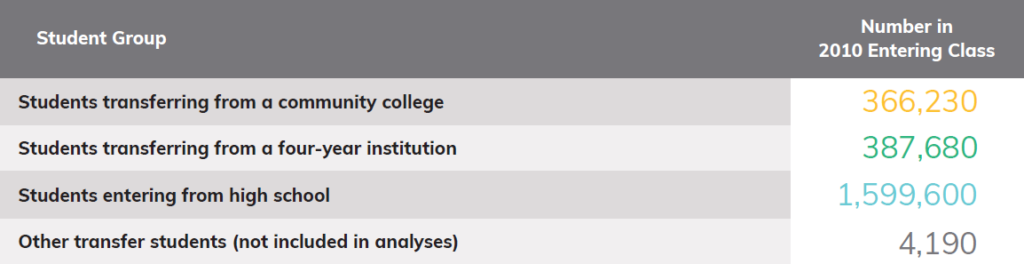
Numbers rounded to the nearest 10s place.
Table 3: Barron’s Competitiveness Categories